Get started with Galigeo For Microsoft Power BI
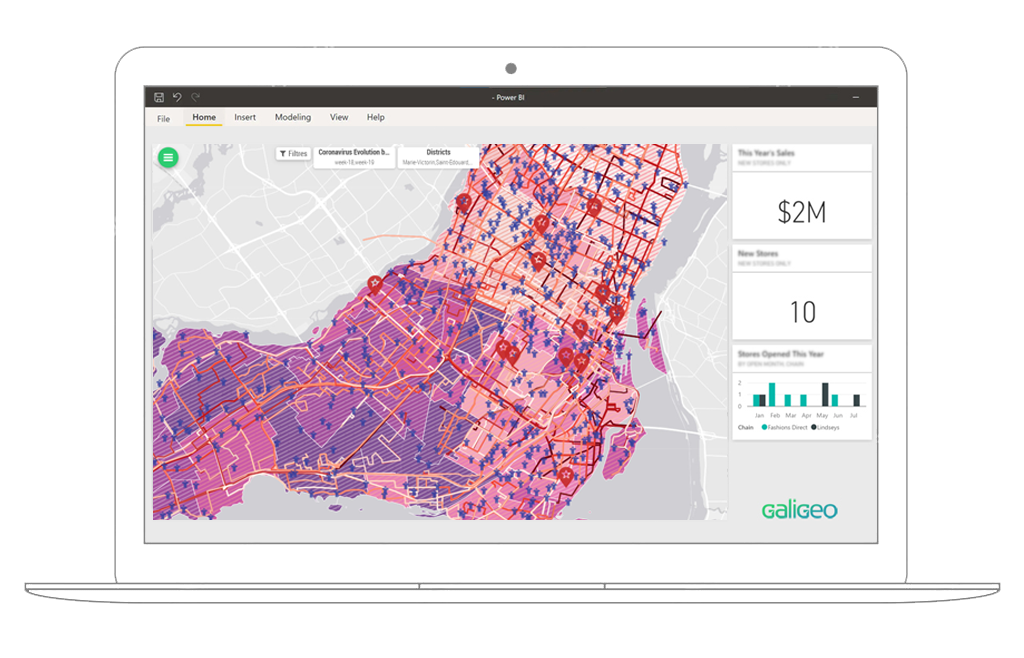
Galigeo For Microsoft Power BI is a performant, self-service Location Analytics solution embedded within Power BI Desktop and Online.
It brings all the core features needed to create and consume compelling and meaningful geomaps of your data directly within your Power BI environment, and leverage powerful spatial analysis features.
With this Get Started guide of Galigeo for Microsoft Power BI, you will be able to install and start using Galigeo in a few minutes.
1. Install Galigeo For Microsoft Power BI
Open your Power BI Desktop, or connect to Power BI Online.
Open an existing report or create a new one (switch to Edit mode if needed).
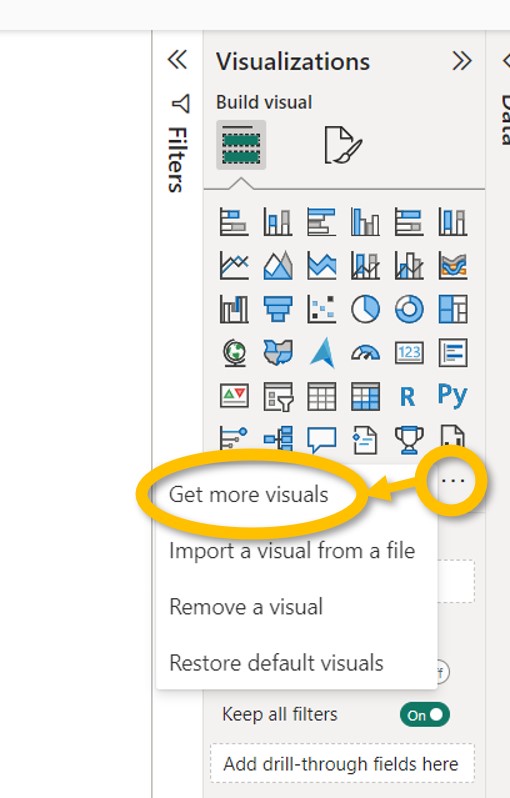
Open the Visualization panel on the right, click on the “…” icon and select Get more visuals to open Microsoft AppSource.
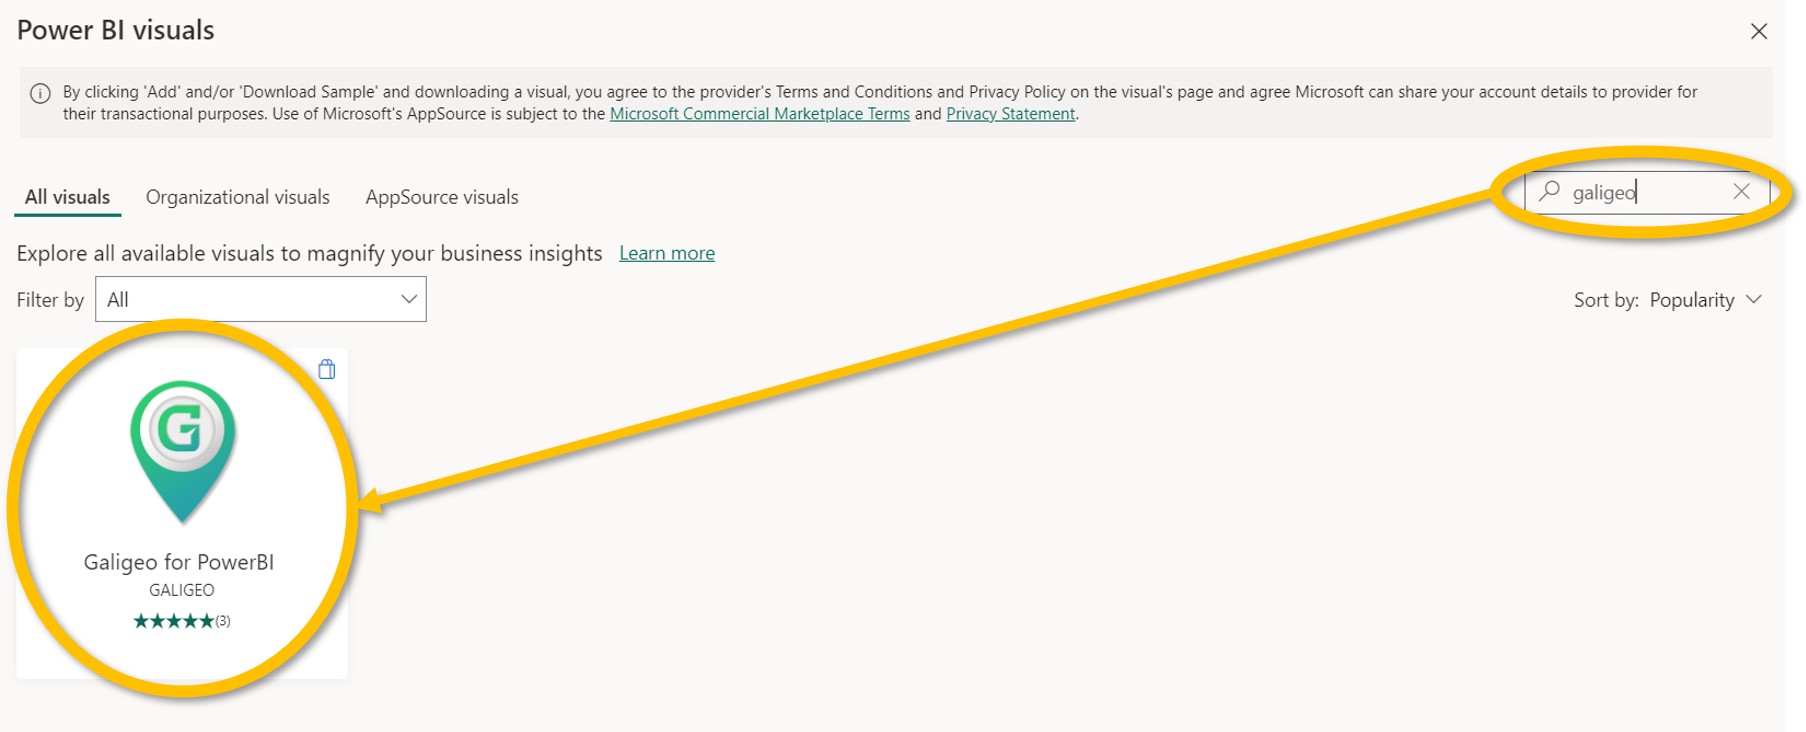
In the AppSource window, type in “galigeo” in search-bar on the top-right.
The Galigeo for Power BI visual will show up in the result, click on it.
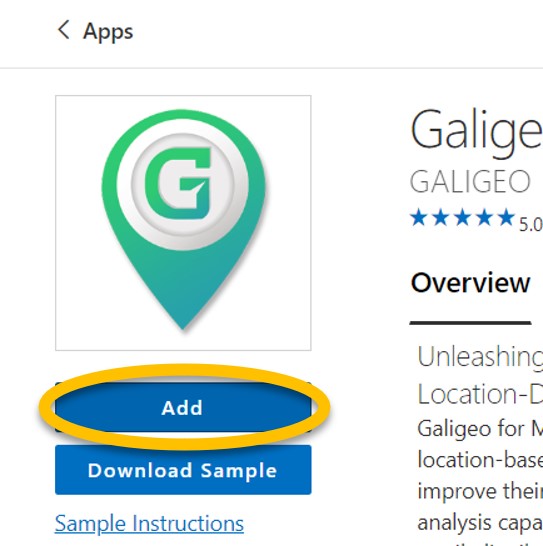
Click on the “Add” button to install Galigeo. A success message will confirm when the installation is complete (should take a few seconds).
now appears in the list of available visualizations, and is ready to be used.
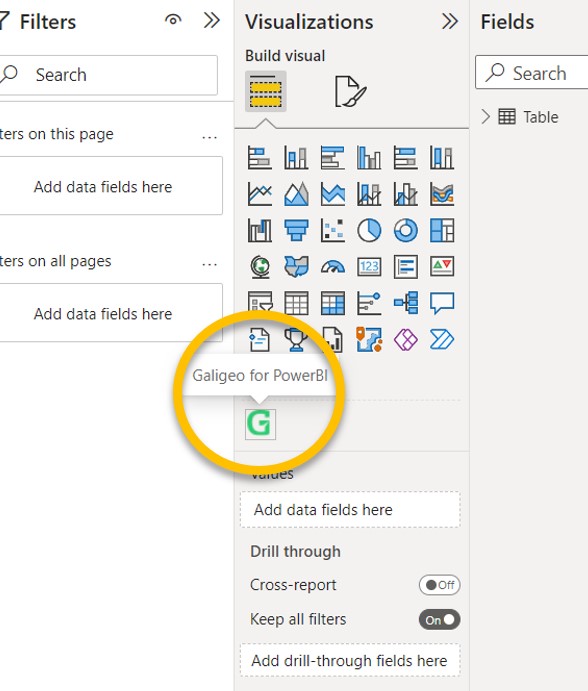
2. Insert a Galigeo Map in a Report Page
Click on the “Galigeo” icon from the Visulization list, a new visualization will be placed on your report.
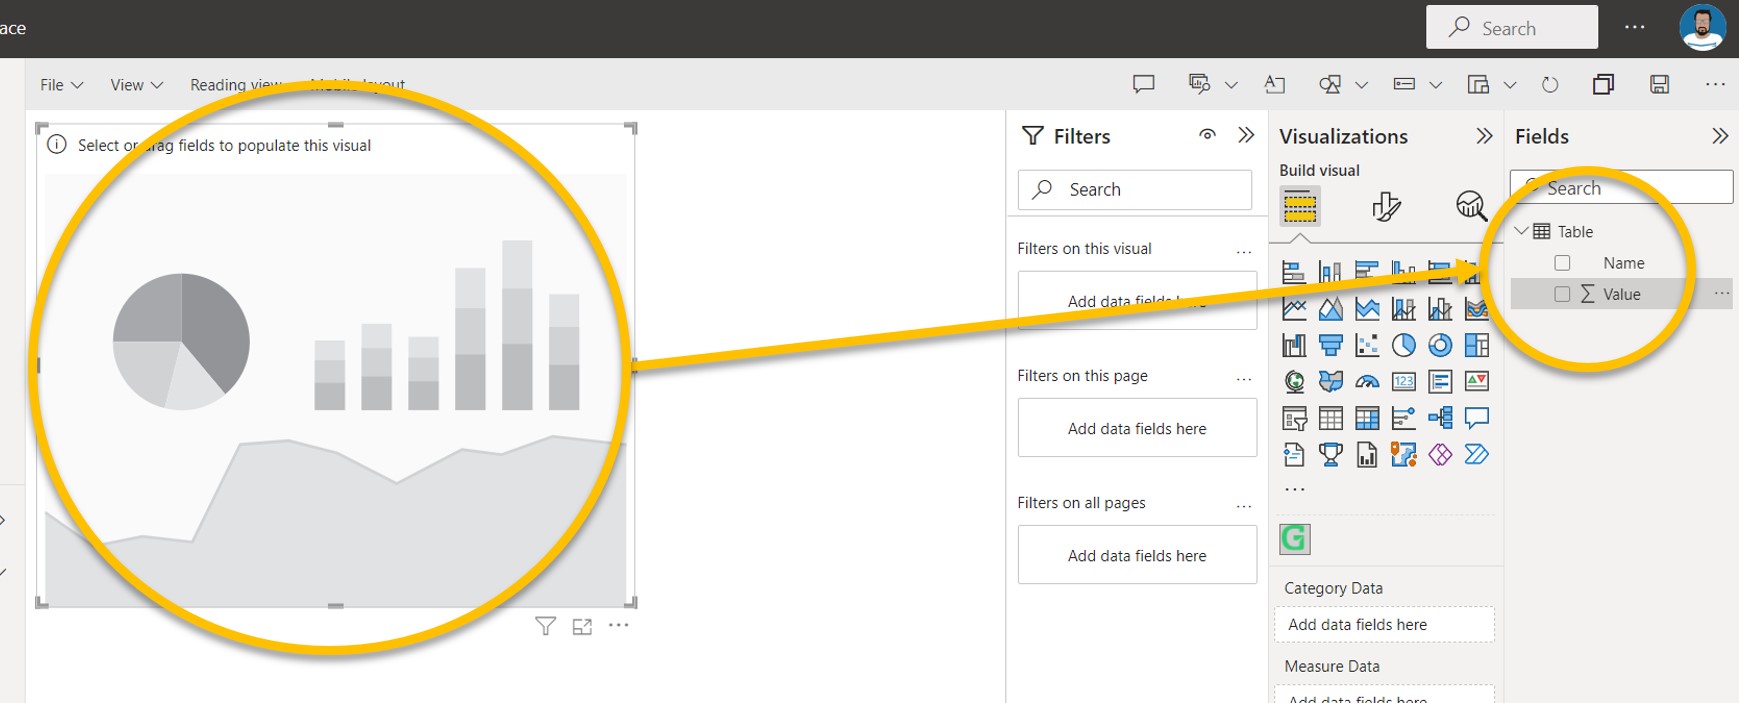
By default, the Galigeo Visual is blank, you need to add data to it in order to start configuring it.
Select the Galigeo Visual on the report, and assign the data you want to it, using the standard Power BI way of assigning data.
Note that at this point you can already freely resize the Galigeo Visual, like any other visual.
On the Visualization tab, click on the “Format your visual” icon, and open the Galigeo Config menu.
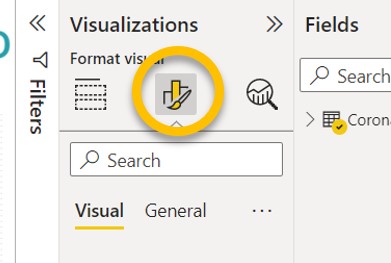
Here, you will have to fill in three inputs, as follow:
- Galigeo URL: the URL pointing to your Galigeo environment (the URL is provided to you in the mail following your trial request)
- API Key: the Galigeo API Key in order to activate your license (the API Key is provided to you in the mail following your trial request)
- Map ID: a unique ID for this map
When this is done, the Galigeo Visual will start loading.
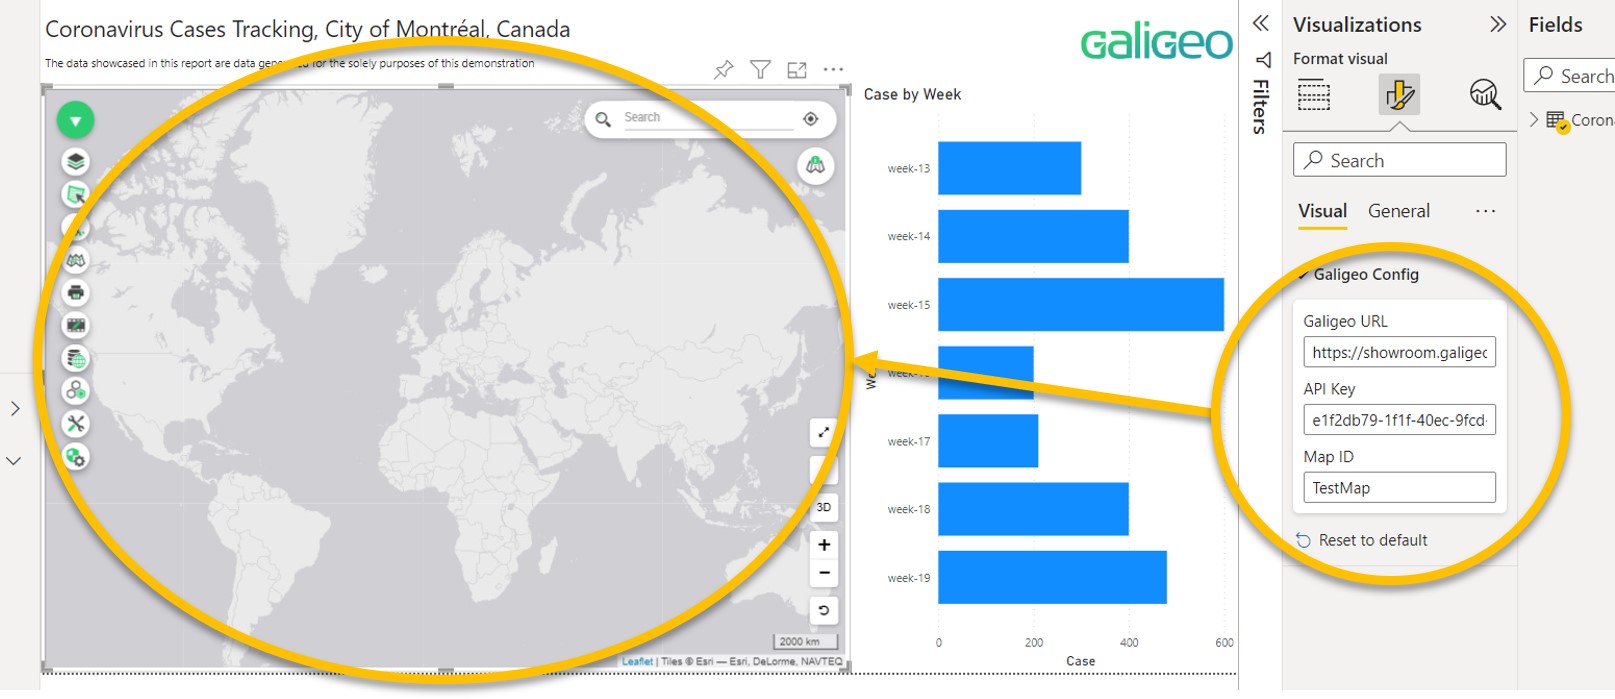
If you see a basemap appearing, you are good to go!
3. Create Your First Map
This part aims to help you understand the core concepts of geomapping that will allow you to plot any business data on a map.
To help you getting started fast, the following will use a sample dataset that you can download here .
Once you have downloaded the Tutorial Dataset (link above), import it in a new Power BI report.
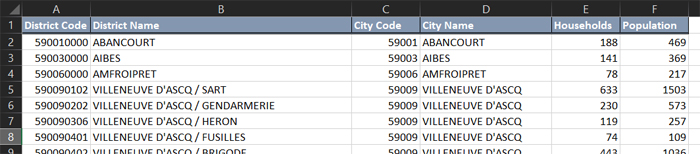
The dataset is containing open-source data for France, and is made of the following columns:
- District Code: Category – A unique code for a given French District
- District Name: Category – The name of a given French District
- City Code: Category – A unique code for a given French City
- City Name: Category – The name of a given French City
- Households: Measure – The count of households by District
- Population: Measure – The count of population by District
The first thing we want to do is to plot our Population and Households by cities.
In your freshly created report, place a Galigeo map and click on it. Then make sure you are on the “Add Data” section of the Visualization Tab.
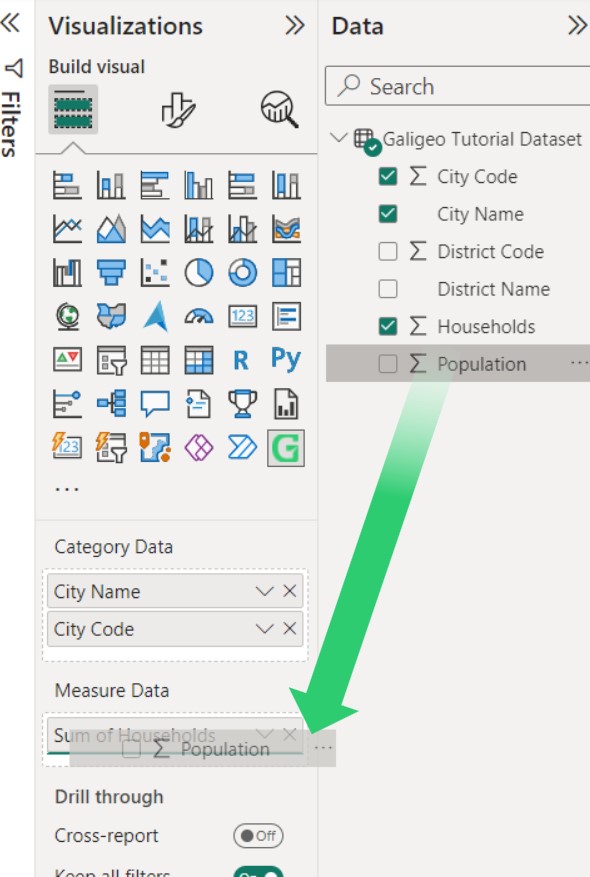
Bind the “City Name” and “City Code” to the Category Data feed, and “Households” and “Population” to the Measure Data feed
Now, in order for the map to load, you need to add your Galigeo API key. Please follow the “Step 2. Insert a Galigeo Map in a Report Page” if needed for this part.
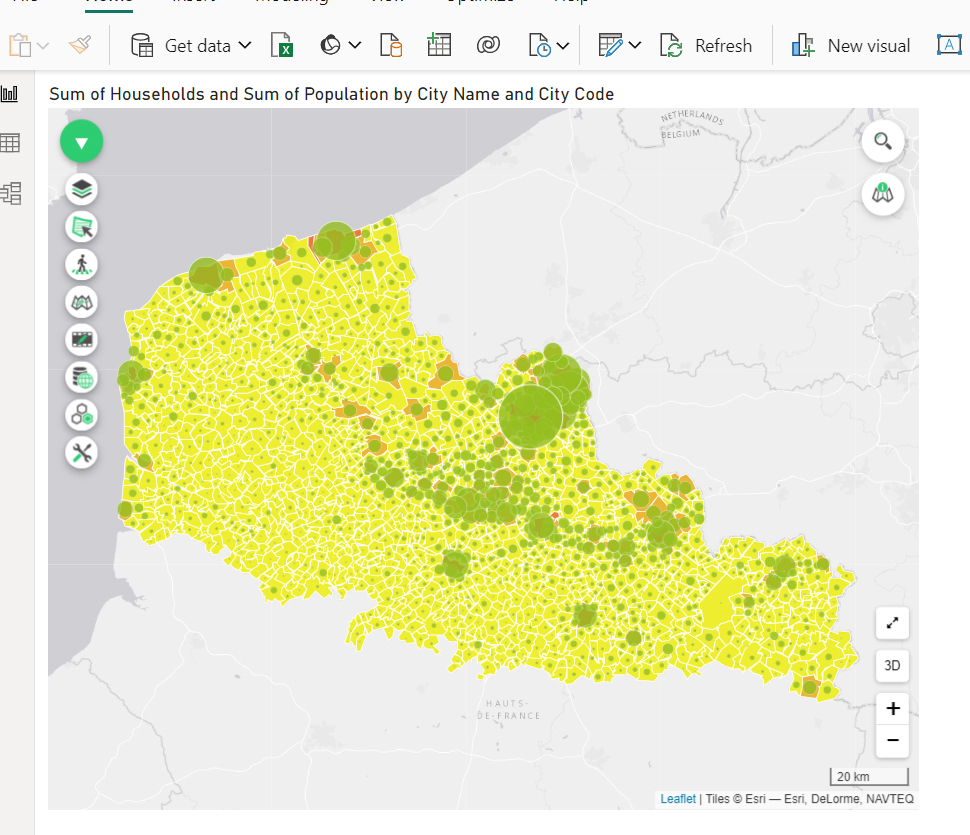
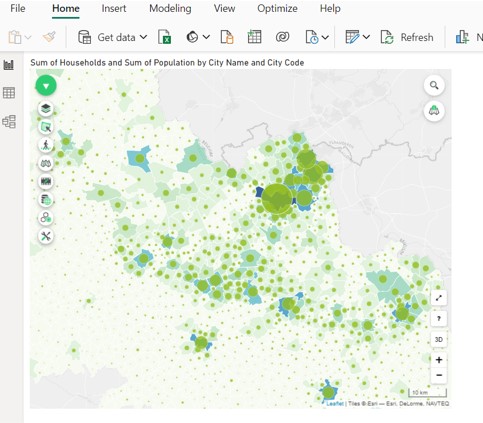
Once the map has finished loading, you should now see some polygons (the cities) displayed on the map as a choropleth! It seems like magic? Well it is 😉
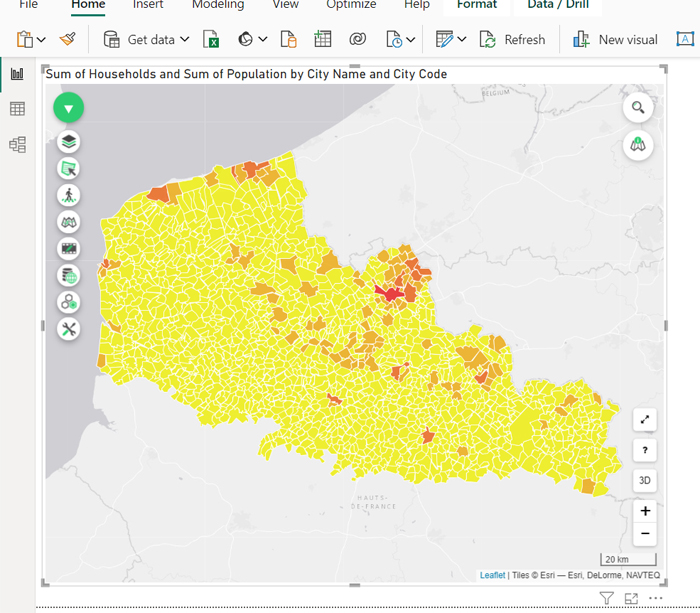
Behind the scenes, Galigeo used its Smart Mapping Engine, analyzed the data provided by Power BI (the ones you defined in both Category and Measure Data), and tried to automtically determine if some corresponds to known existing geodata, such as administrative boundaries.
Now, let’s take a look at how it works more in depth.
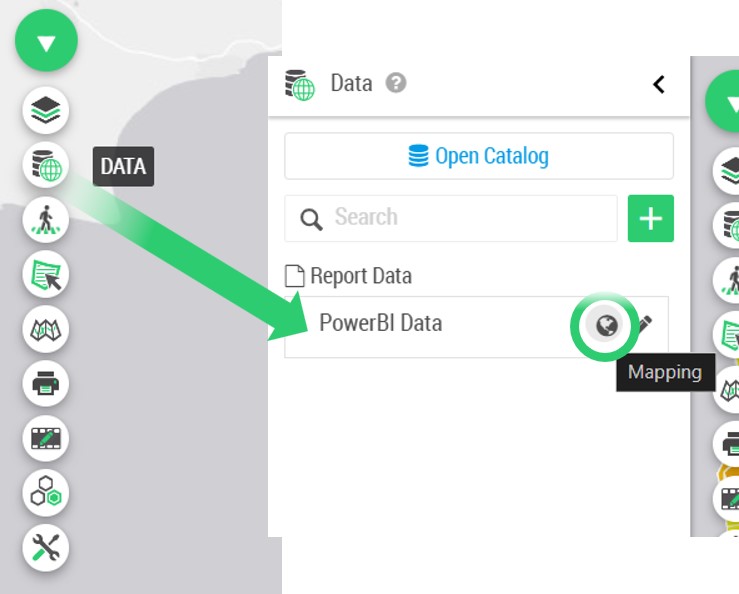
Move your mouse accross the map, and click on the top-left icon. It will display all features available to you. From this list, click on the Data icon to bring a new panel on the left.
You will see one dataset called “Power BI Data”. Drag your mouse over its name, you will see new icons appearing. Click on the World icon (called Mapping), and a new modal window will appear.
This modal window, opened on the Mapping tab, lets you control how you want to join your BI data with geographical data (also known as geodata). In our case, you can notice that Galigeo selected the column “City Code”, that contains unique codes for each City in France, and associated it with a geodata called “FR_City”, that owns a column called “INSEE Code” which contains the same unique codes.
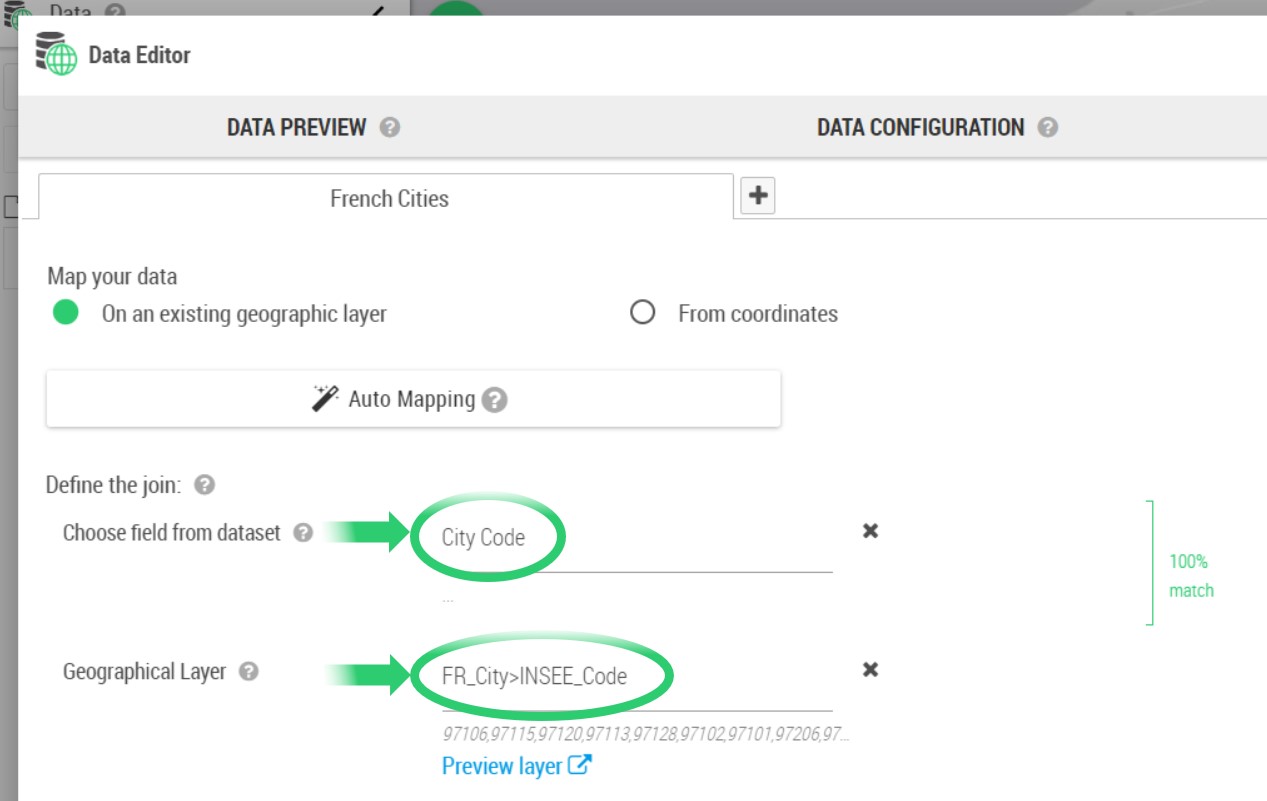
This way (but not the only), Galigeo is able to display the corresponding polygons for each city, and display a KPI on top of them.
You can apprehend this as a “joint” like you would do to join two Excel files together using a common dimension between the two.
But in this case one of the Excel file is your Power BI data, and the other is a Geodata.
When you understand this core concept, it starts to be really easy to display whatever your business requires on the map: for instance, if you have a column containing Railway IDs in your BI data, you can join this column to a geodata representing the Railways as lines, containing the same IDs.
Now, let’s see how we can add another layer on the map.
If you don’t exactly know what is a layer when it comes to geomapping, you can envision this as the representation of one KPI on top of one geodata.
In Galigeo for Power BI, click again on the Data tab, and this time click on the name of the Power BI dataset (“Power BI Data” by default). It will expand the avaiable columns that the map can use (corresponding to the ones you selected initially).
Click on the Population data and hold your click, now do a “drag-and-drop” over the main map. Galigeo will show you different possibilities to represent the Population data, in our case as we already have a choropleth displayed on the map, choose “Proportional Symbols” and release your click.
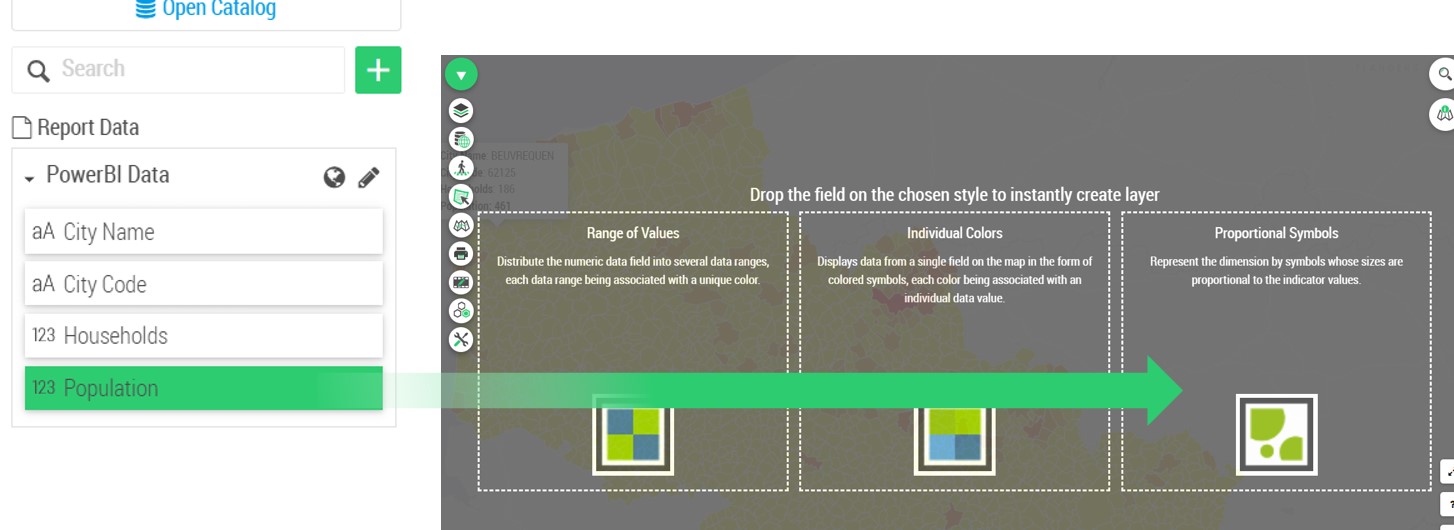
Now, you will see Bubbles appearing on top of each cities, you just added another layer to the map! Congratulations :-).
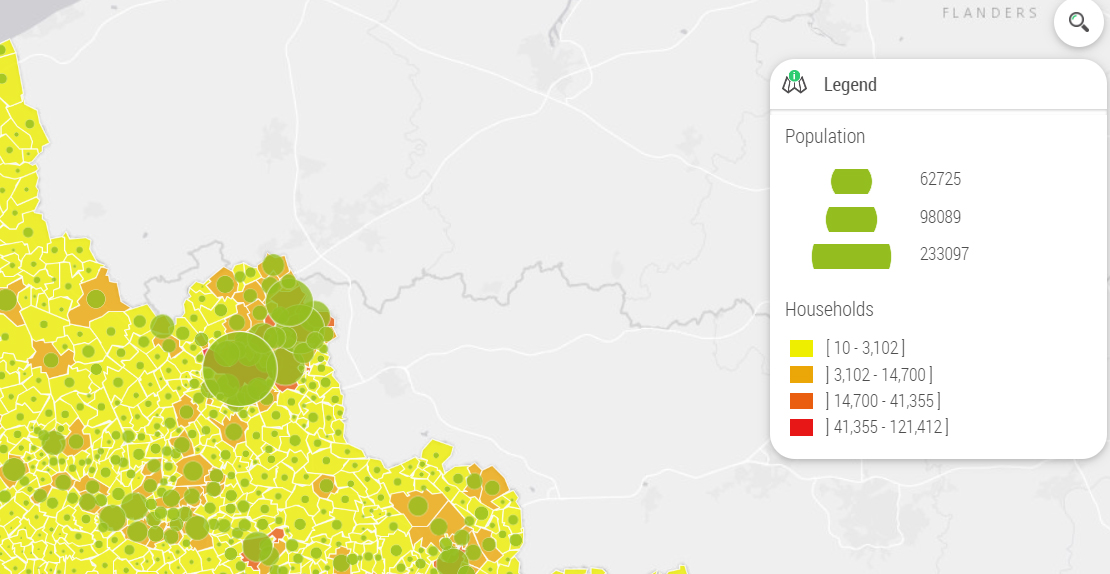
If you click on the Legend (right of the map), you can see that the Households are displayed as choropleth, and Population as Proportional Symbols .
And you know what, best is that you can add as many layers as you want! But for now, let’s focus on customizing the way our layers look like.
4. Customizing Your Map
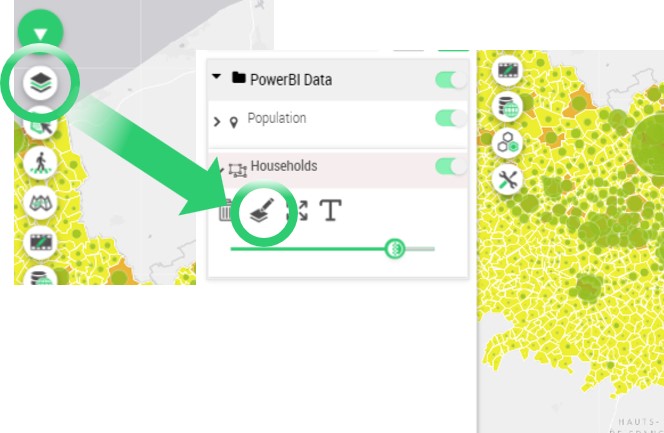
Galigeo for Power BI lets you customize any layer you created (as we did at Step #3 for instance) to look like the way you want.
To do so, open the Layer panel, click on the name of one of the layers you want to customize to open its options (in our case, we will edit the Households layer made of polygons). Then click on the Edit icon, symbolized by a pen on top of layers.
You then reach a new window, called “Layer Wizard”, where you can customize the way your layer looks like (in our case, the polygons displayed as choropleth using a yellow to red gradient).
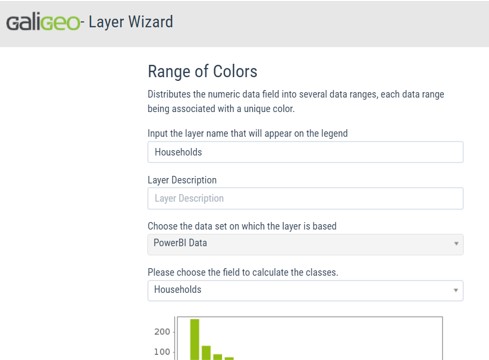
Amongst the many options, you can rename the layer, switch the measure used, play on the opacity, and so on. To find all options available, please check out the complete documentation.
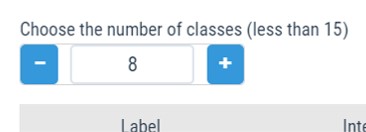
Scroll-down a bit to find the Number of classes set of options. Instead of 4 classes, choose 8, and then click on the Theme button and select a new theme.
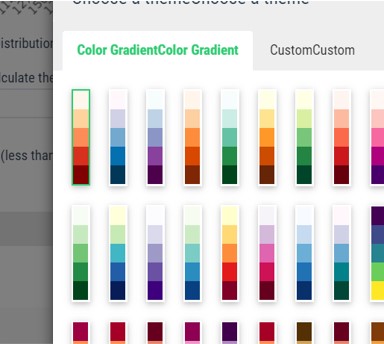
Validate everything, then click on the Save button on the top-right.
Go back to Power BI, refresh the page where you are creating the map. You now see your new theme applied to the layer. Congratulations!
5. Going Further
For more informations about Custom Visuals in Microsoft Power BI, you can check the official Microsoft Documentation.
Start your free trial of Galigeo for Microsoft Power BI right now.