Suivez nous :

G19.5 introduces bi-directional interactivity between maps and charts, an enhanced Smart Query Builder, custom symbology support, and advanced map clipping capabilities.
Bi-directional Interactivity
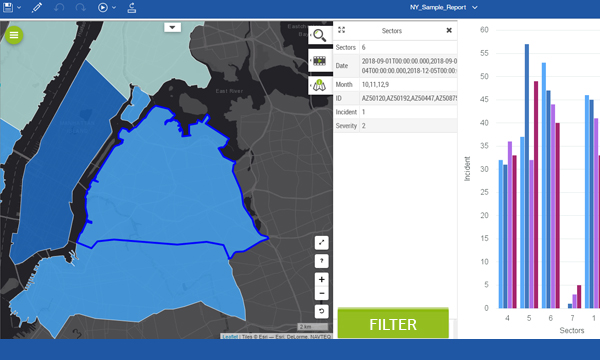
Synchronized Visuals: Create seamless interactions between maps, charts, and tables. Filter your report visuals directly through map actions, such as clicks or spatial selections. Fully compatible with SAP Web Intelligence 4.2 SP3+ and IBM Cognos 11+.
Smart Query Builder
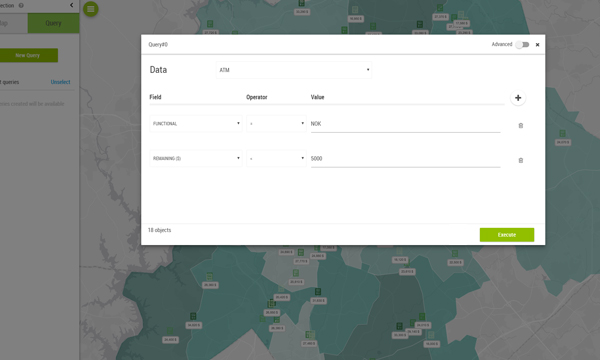
Codeless Data Exploration: Filter and export your critical data without any SQL knowledge. Intuitively combine multiple search criteria and spatial selections for deeper insights.
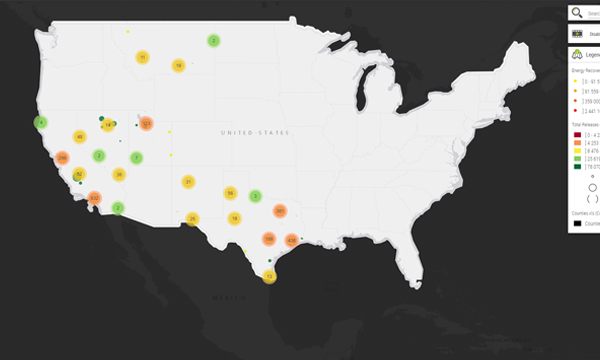
Custom Symbology
Vector-Based Styling: Import custom vector icons to tailor your data representation on the map. Features an entirely refreshed symbol library for more expressive and professional cartography.
Map Clipping
Targeted Focus: Concentrate on specific geographic areas by clipping the map to your exact needs. This feature significantly improves presentation quality and optimized print outputs.
Performance
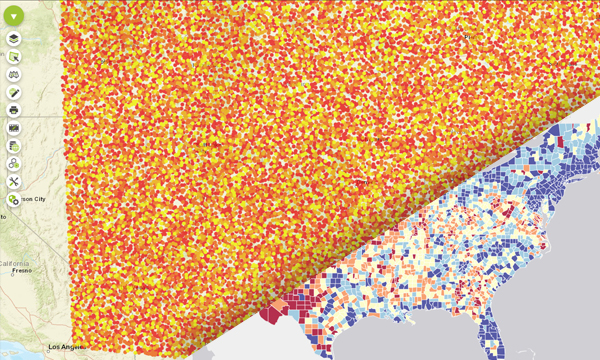
High-Scale Rendering: Faster data loading and display with support for even larger datasets. Experience fluid navigation with up to 800,000 data points displayed simultaneously.

Grégoire Delaporte