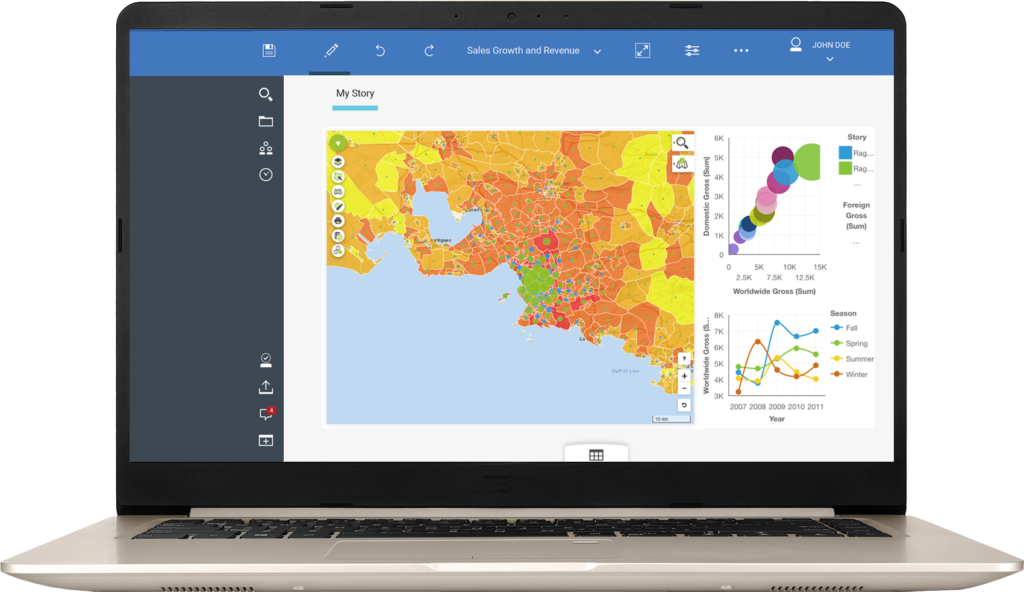
Get started with Galigeo For IBM Cognos Analytics
Galigeo For IBM Cognos is a performant, self-service Location Analytics solution embedded within IBM Cognos Analytics.
It brings all the core features needed to create and consume compelling and meaningful geographical views of your data directly within IBM Cognos.
It works on both IBM Cognos Analytics 10 and 11.
You can try the product for 30-day free .
Galigeo is the solution of choice if you seek a performant Location Analytics to replace your deprecated ESRI Maps for Cognos.
Learn more .
Get started today by creating your first map and answer all your strategic location-related questions with Location Intelligence.
1. Install Galigeo For IBM Cognos Analytics
If not done yet, download Galigeo For IBM Cognos Analytics from our website.
A 30-day trial is included inside.
Once the download is complete, unzip the downloaded package.
First thing to do is to deploy the Galigeo webapp. We recommend you to deploy it on a Tomcat Server.
Begin by stopping the Tomcat service.
Then go to your main Tomcat folder, then in the webapps folder, and copy paste in it the Galigeo.war from the package you had previously downloaded and extracted.
You can then restart your Tomcat Service.
Once this is done, you have to define the main folder (repository) that Galigeo will be using to work (metadata saving, …).
For that, open your browser and navigate to http(s)://<Tomcat Server URL>:<Tomcat Server Port>/Galigeo, then follow the steps to create your repository.
2. Create your first map
You need to connect as a user with enough rights to create and modify reports.
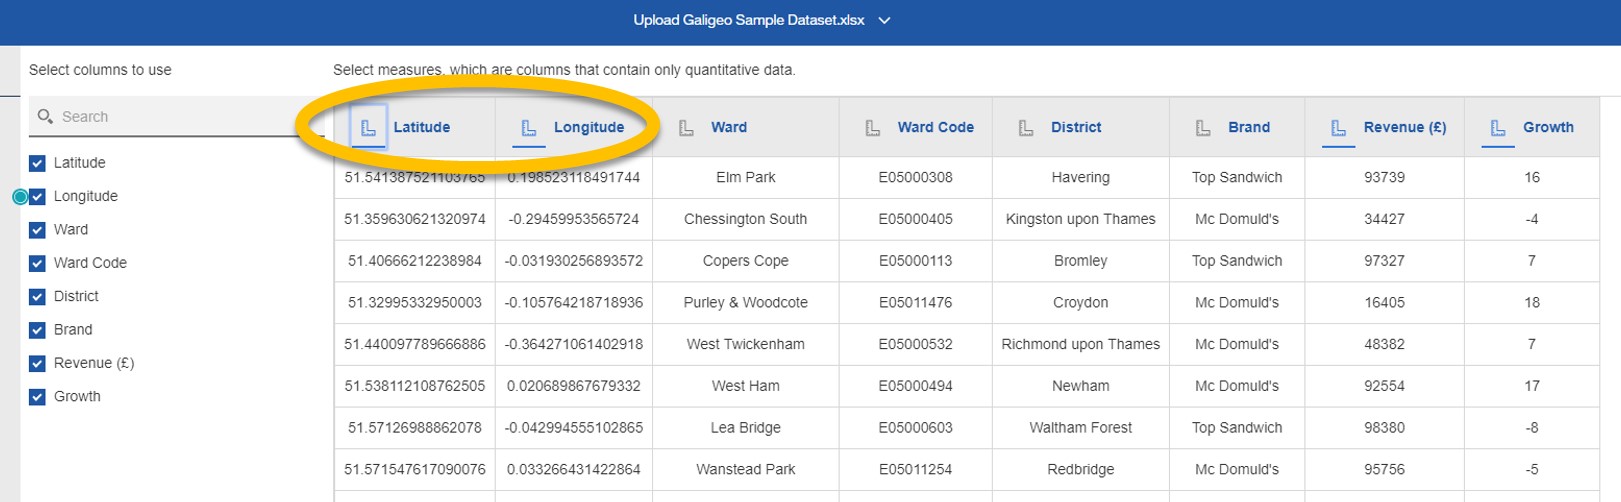
For the sake of this guide, we will use an Excel dataset containing dummy sales data.
Download the sample dataset
Begin by importing this Excel file to the Cognos Analytics portal using the standard way.
Simply select all the columns contained in the Excel file, then create and save a Data Module on top of it.
Create a new Cognos report using the blank template, and use the freshly created Data Module as the main datasource.
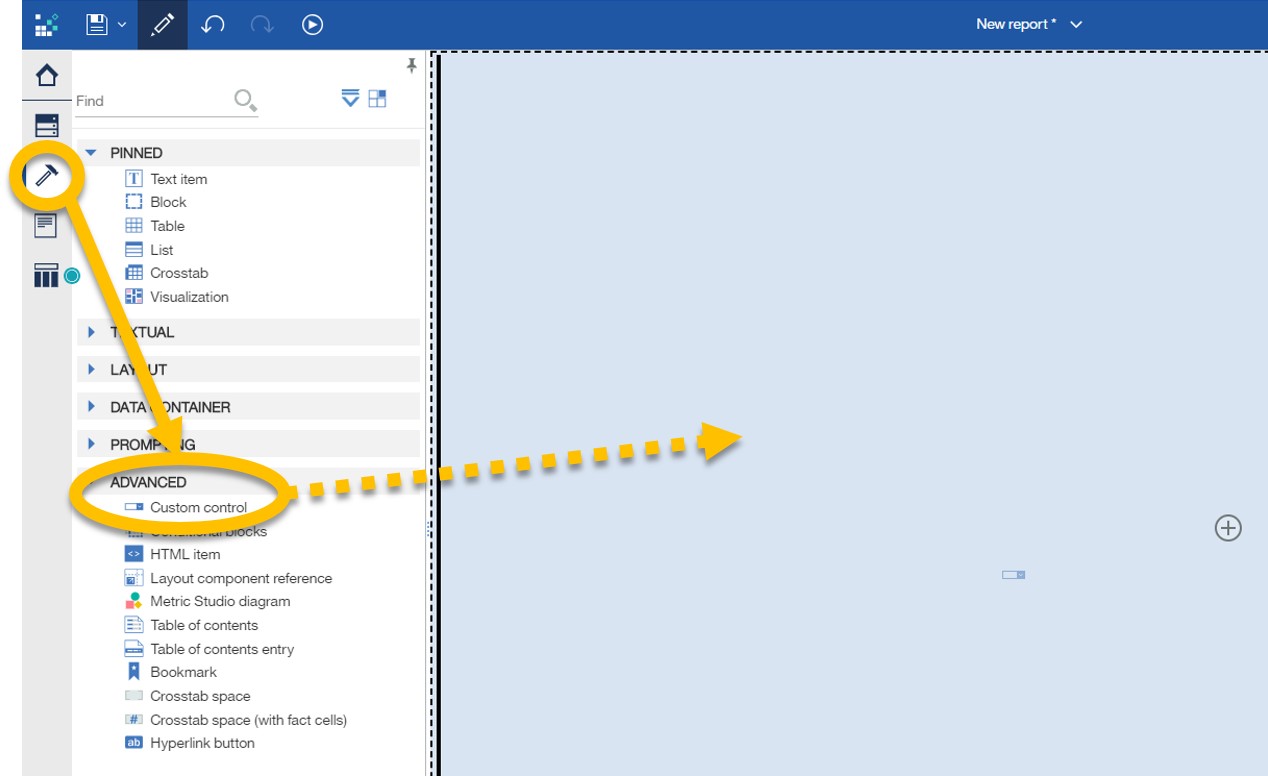
From the left menu, click on Toolbox, then go to Advanced, and place a Custom Control in the report.
Click on the Custom Control added to your report, and open its Properties from the top-right toolbar.
Assign it a new size, the one you want. In this case the size defined is 700*800px.
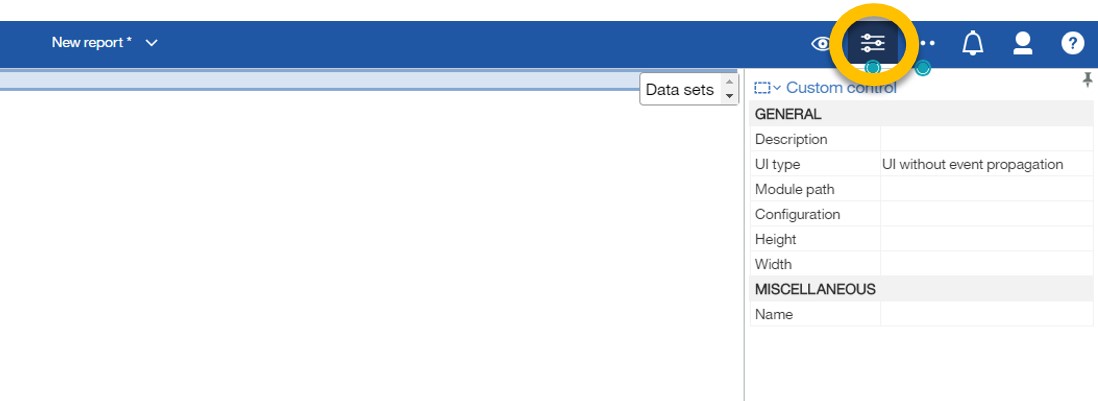
Still from the properties, open the Module Path property.
In the newly opened input, type http://<Server URL>:<Server Port>/Galigeo/viewer/jsp/lib/customControl.js and save this property value.
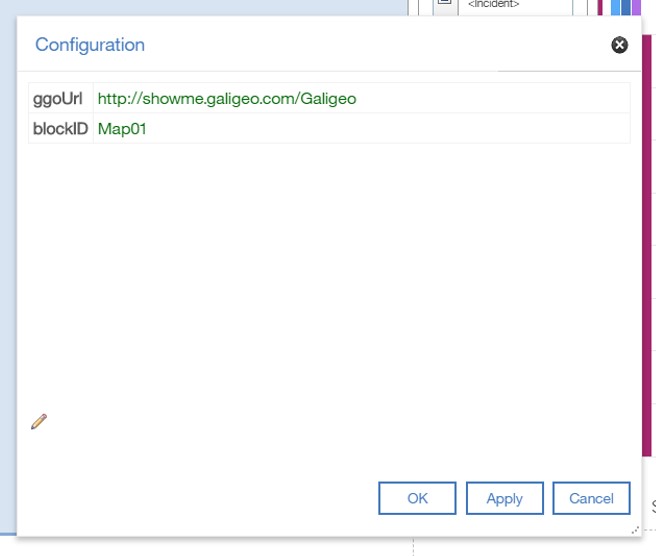
Now, open the Configuration property, and copy/paste the following configuration.
{
« ggoUrl »: « http://<Tomcat Server URL>:<Tomcat Server Port>/Galigeo »,
« blockID »: « Map01 »
}
Click on Apply then OK, and close the Configuration property panel.
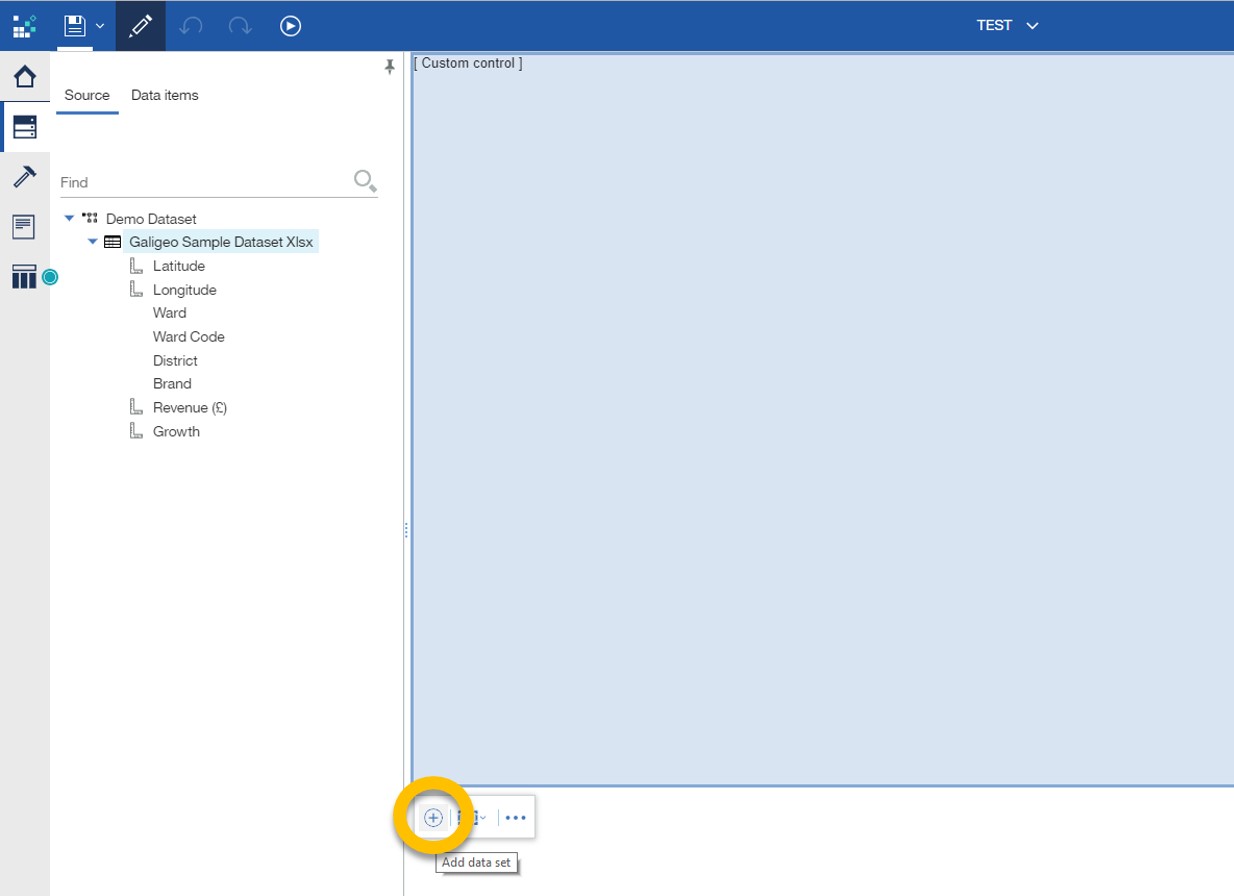
Now, we are going to bind the datasource to our map component.
Click on the Custom Control. A toolbar displays, click on the + icon to add a dataset to the component.
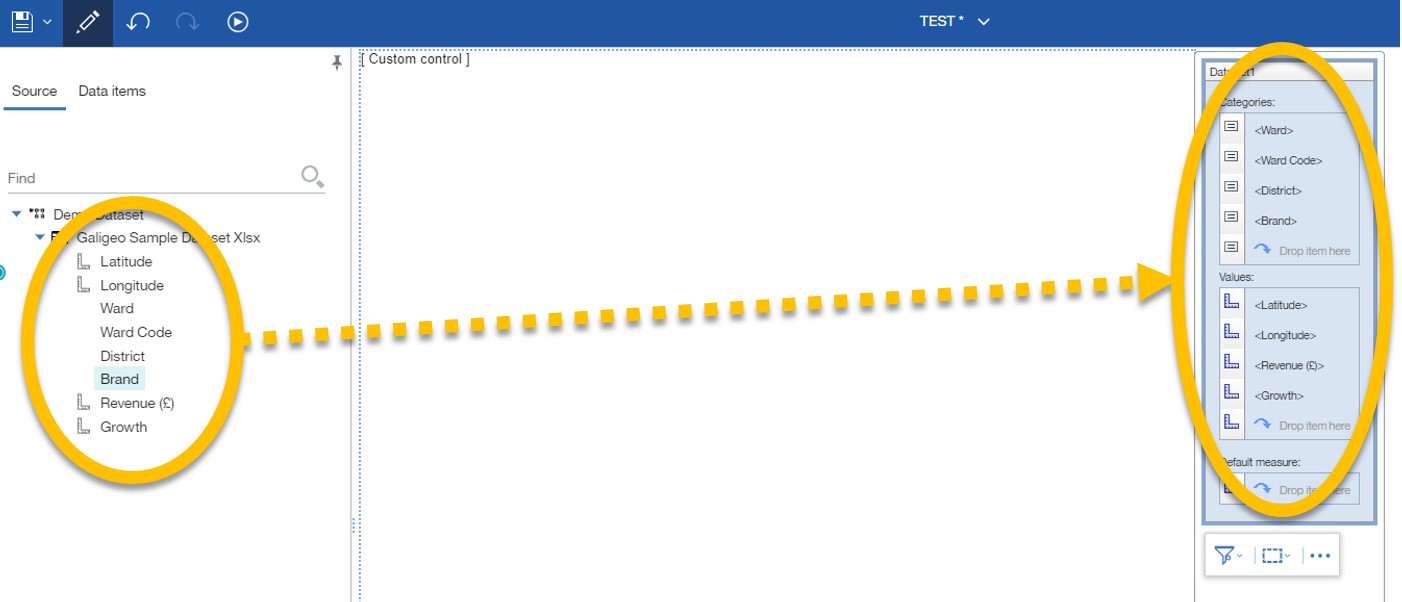
Then on the new dataset inputs created at the right of the Custom Control, and drag and drop all the dataset columns in the Categories inout if they are alphanumerical, or in Values if they are numerical.
At this point, you can already check if the map was successfully created.
Save your report, close it and reopen it (mandatory only the first time you create a Galigeo in a report).
You should now see a map ?.
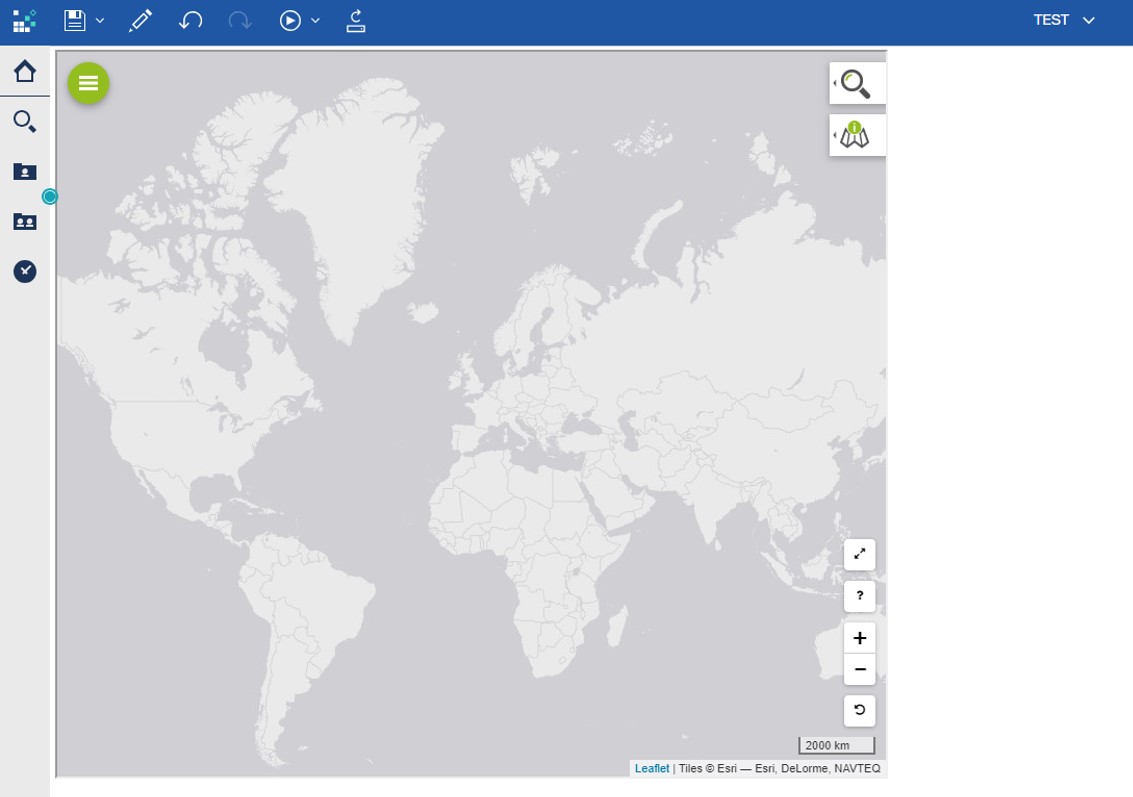
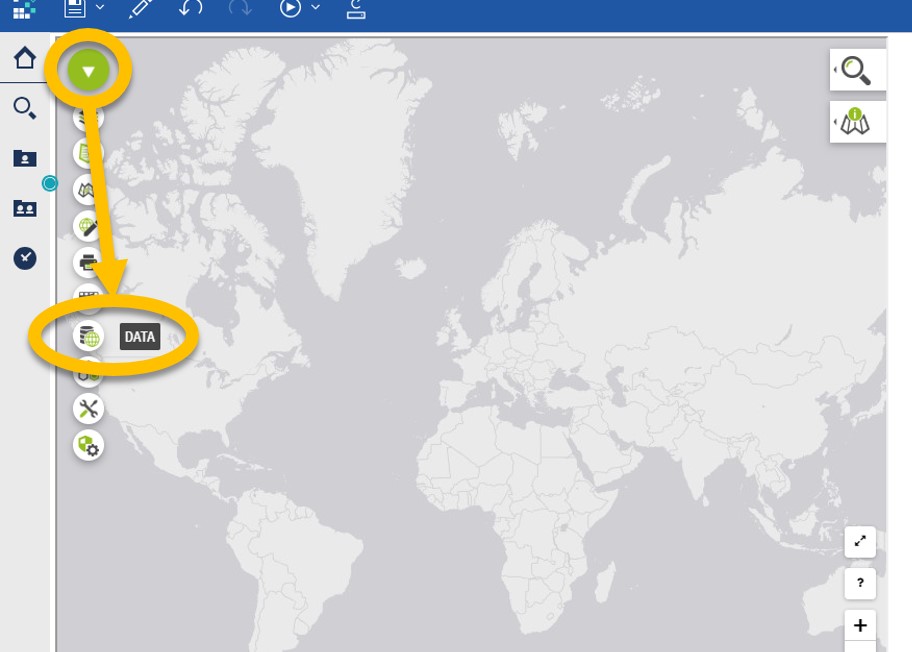
On the top-left of the Galigeo map, you can access the main menu. It contains multiple tabs, that let you access to the different features offered by Galigeo.
Click on the « Data » tab.
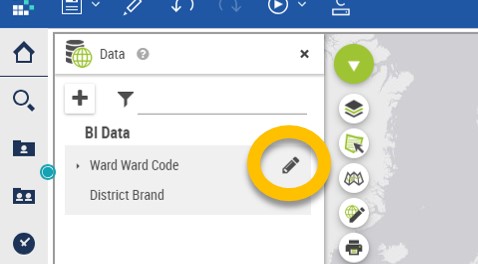
You now see a list of dataset available for this map. For the moment there is only one (tagged as BI data), but you could add other dataset from various sources.
We are going to define which data will be used to display our KPI on the map.
Click on the pen next to the BI dataset to edit it.
If you take a quick look at the dimensions available, you will notice we have longitude and latitude available.
We will start with that.
First, go to the Data Configuration tab, and make sure the Longitude and Latitude dimensions are set as « Number ».
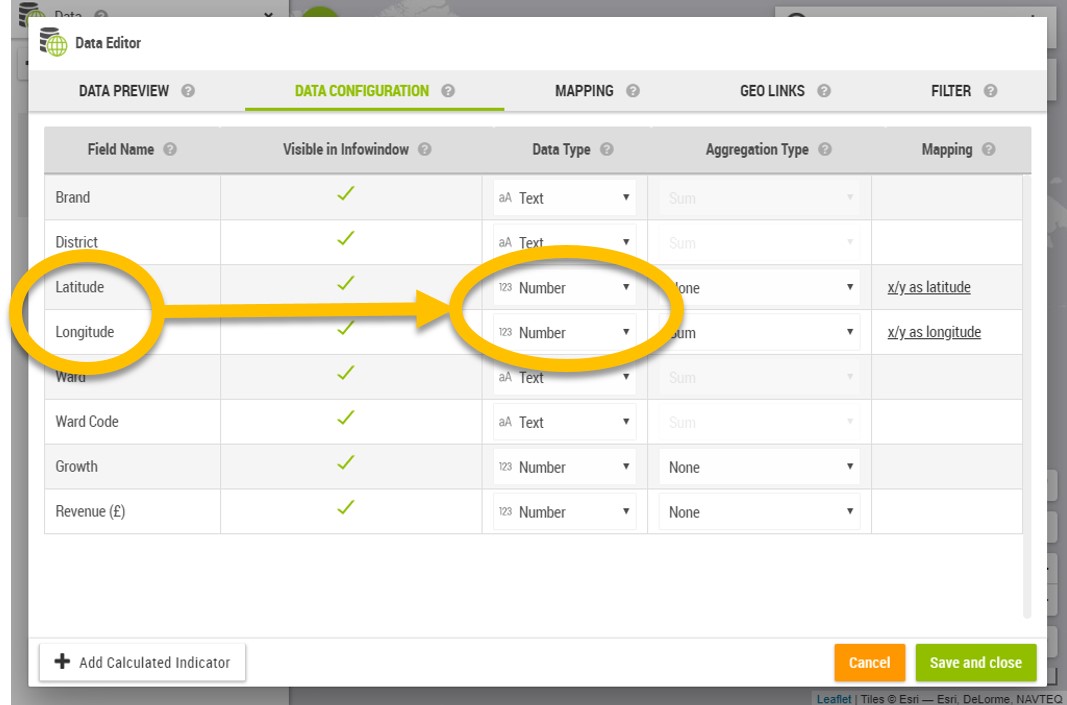
Then switch to the Mapping tab.
We are going to choose which mappers we want to define to map our data on the map.
To sum it up quickly, a mapper indicates how to link together BI dimensions with geodata, in order to be able to blend these together.
In our case, we need to indicate that we want to create a new layer based on X and Y coordinates, contained in our Longitude and Latitude dimensions.
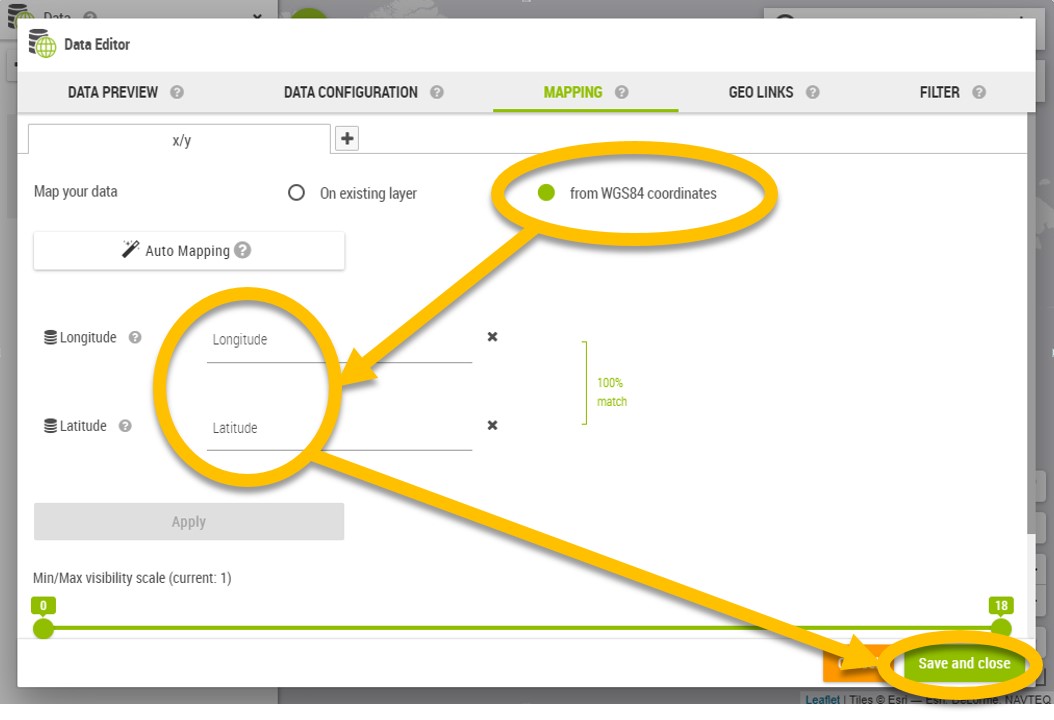
Select « From WGS84 coordinates » from the radio button.
In the latitude and Longitude input, select accordingly the Latitude and Longitude dimensions.
Then click on Apply, wait a few seconds until you see the message 100% match.
You can now click on Save and Close at the bottom of the modal window.
Back to the map, click on the arrow icon of the BI dataset to display all the dimensions available.
Select the « Growth » one, and start dragging it to the map.
Automatically, boxes will appear to let you create the kind of visualization you want.
Drag your mouse to the ‘Proportional Symbols’ box, and drop your click on top of it.
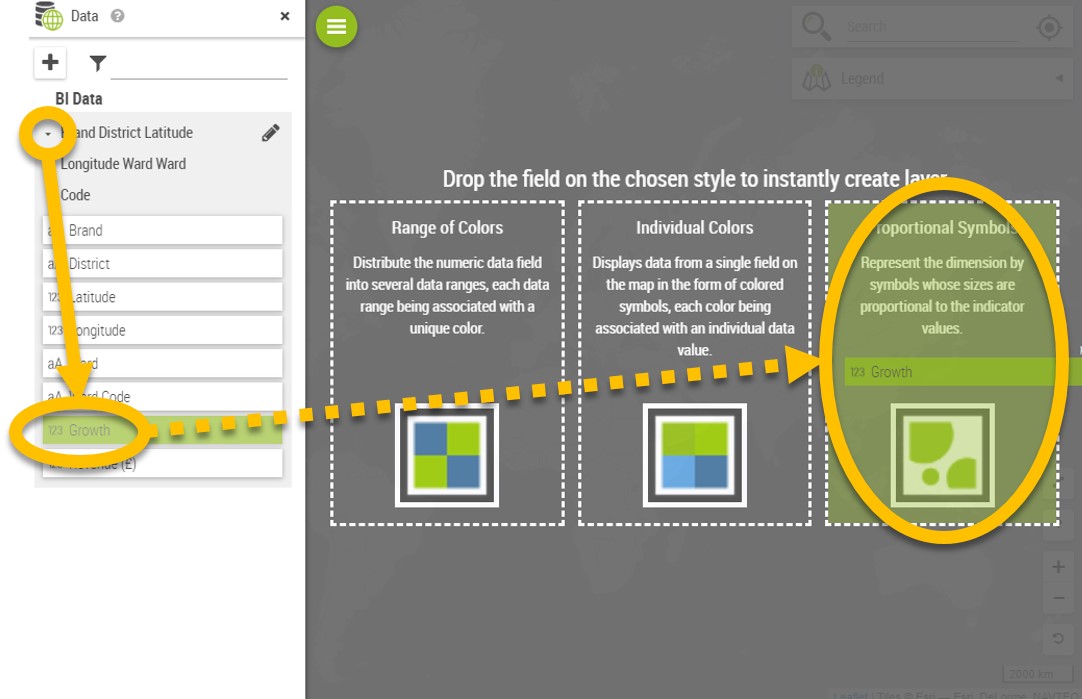
A new layer of information is now displayed on the map, representing your Growth by Shops.
You can click on the legend widget on the right to display more information about what you see on the map.
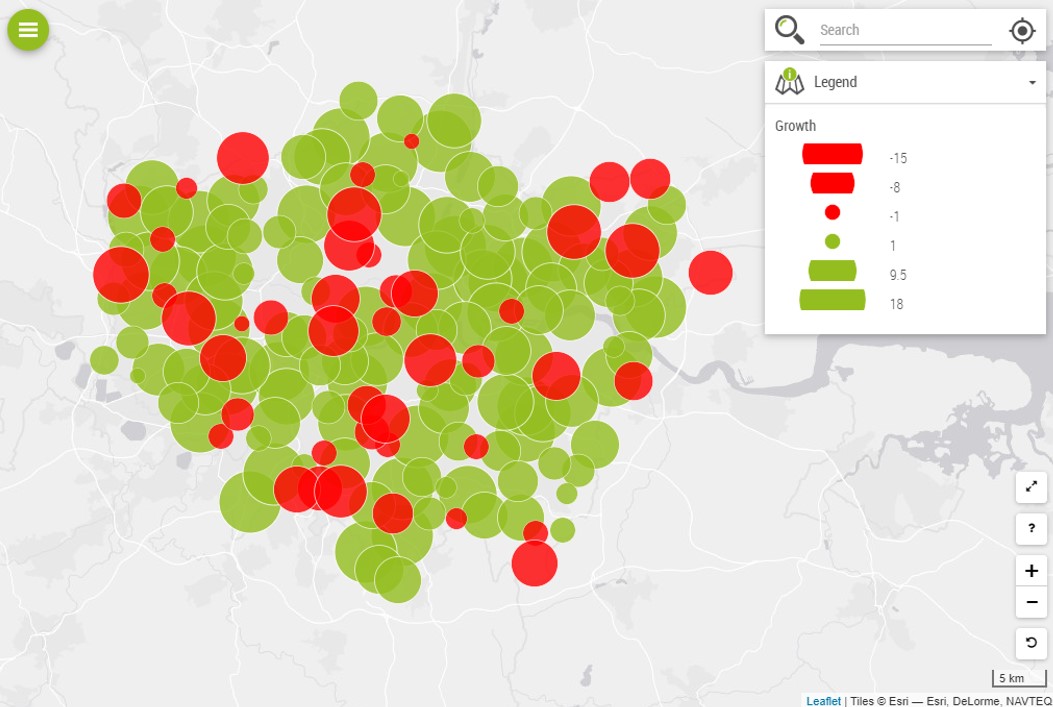
You can already explore the map by zooming in to the street level using your mouse wheel or the +/- button on the bottom-right of the map.
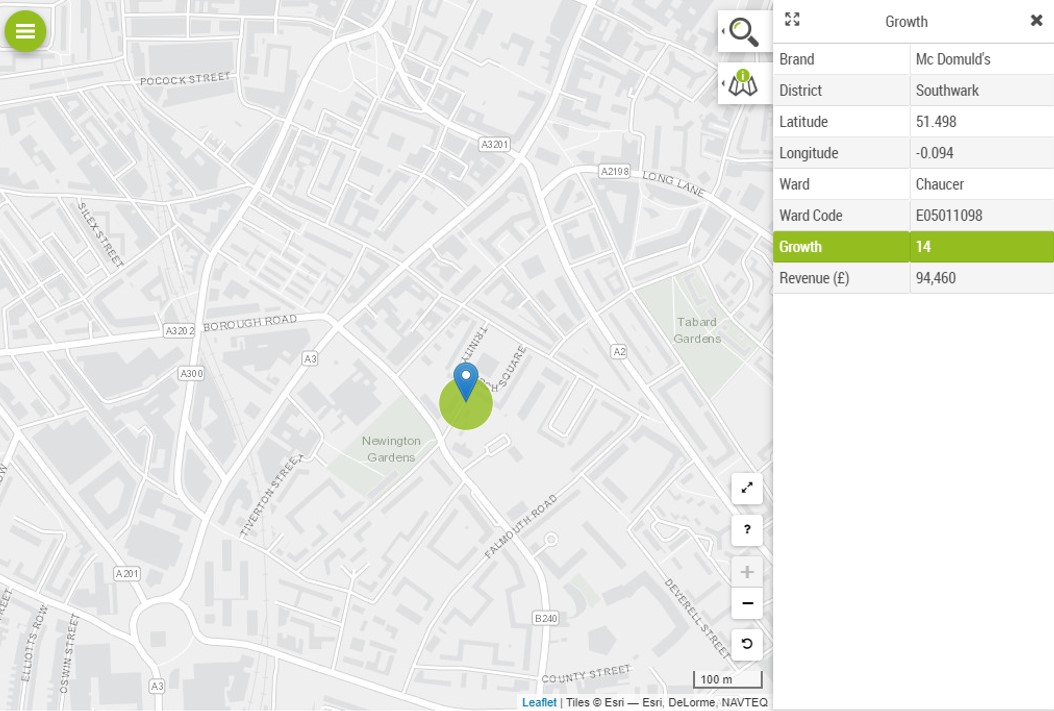
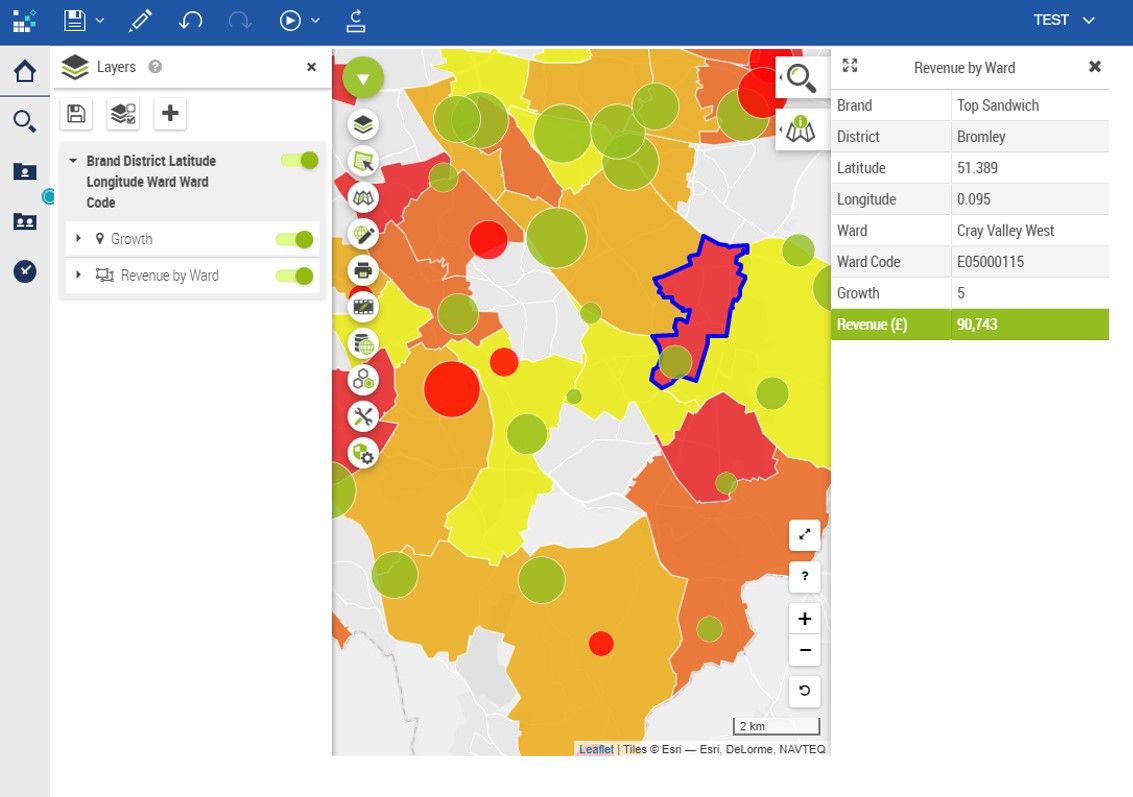
You can also click on any points on the map to open its details.
Good job ?! Let’s now import our own geodata in order to display our KPIs at another level of granularity on the map
3. Import your own geodata
In the previous step, we have been able to successfully plot our shops, represented by longitude and latitude data.
But this was because we directly had these Latitude and Longitude values within our BI dataset.
What if it is not the case?
For example, what if we only have as information in which district a shop is located?
Galigeo can blend together your dimension containing the District information, and a geodata representing the district.
This is what we are going to do right now.
In our case, the dataset being on the City of London, we have as information the district (called Ward in this case) in which each shop is located.
This information is contained both in the dimensions called Ward and Ward Code.
We are going to import a geodata taken from the Open Data portal of the City of London.
You can download the geodata here .
Let’s import the geodata.
For that, you need to open the Galigeo Administration panel, also called Galigeo Manager.
This is accessible from the tabs at the left of the map.
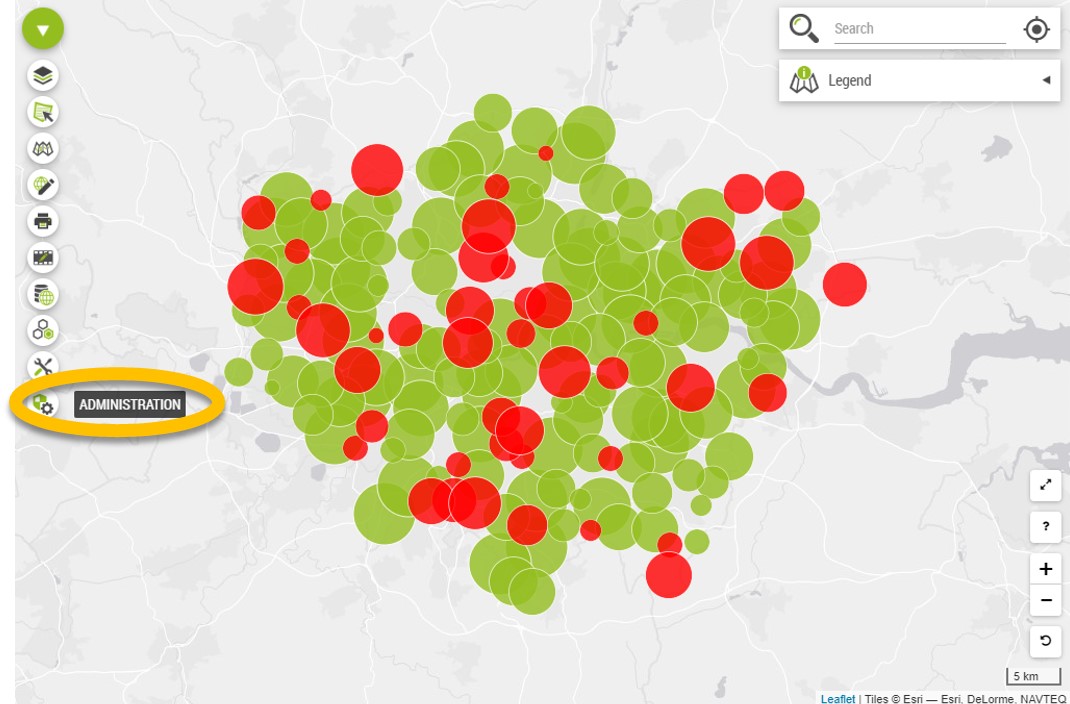
Galigeo Manager could benefit from a tutorial on its own. So for now, let’s focus on the part where we can import our geodata.
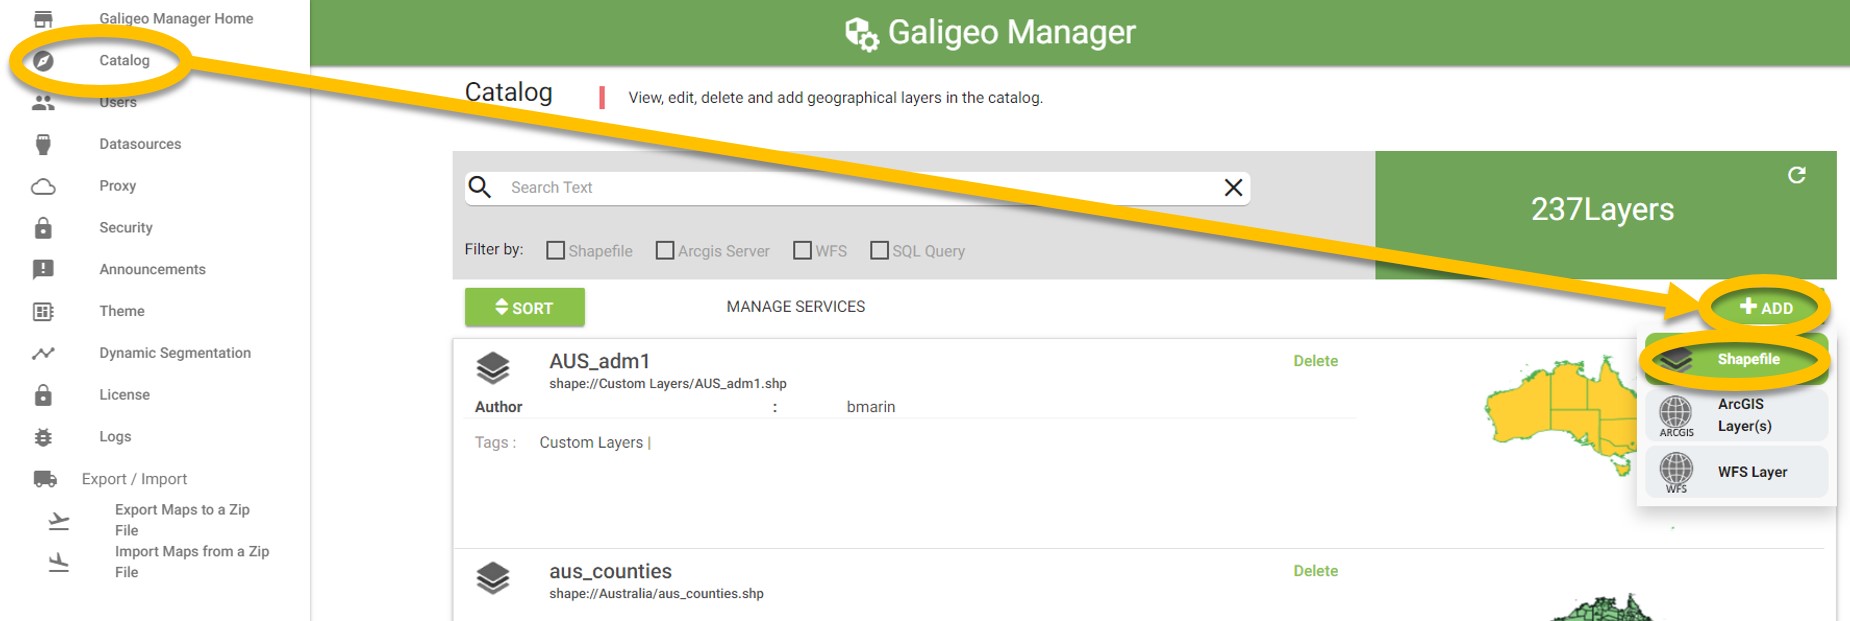
Go to the Geodata menu. This new window acts as a catalog of geodata. You can import as many geodata as you want, from a wide variety of sources.
Hover your mouse on the + Add button, and select Shapefile from the drop-down list.
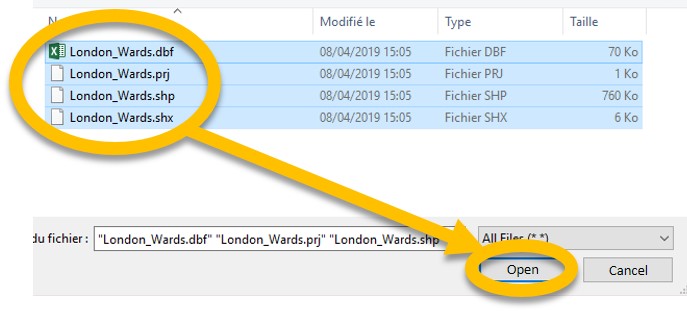
Click then on Browser, than navigate to the unzipped folder of the geodata your previously downloaded.
Select all the files, and click on Open, then on Add to Catalog.
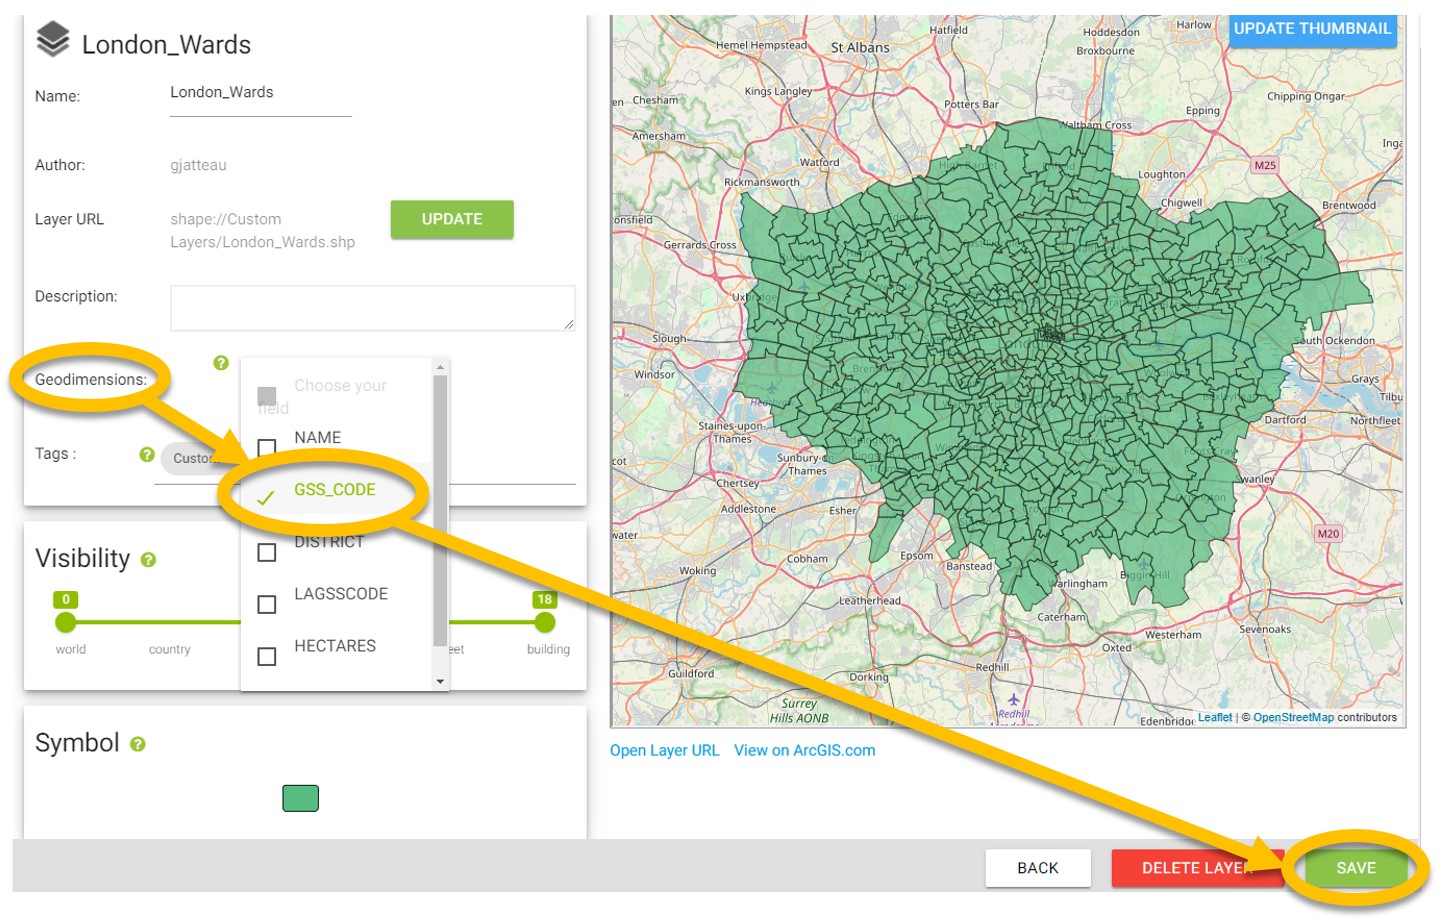
Wait for Galigeo to import the shapefile. You can now see how the geodata looks like, and configure some of its properties.
The one property that matters for us for this tutorial in the Geodimension. Setting the Geodimension indicates which dimension of the geodata we have to use when blending the Wards (polygons) with our BI data.
In our case, select « GSS_CODE », then click on Save.
Our geodata now appears in the catalog list.
We are good to go.
You can close the Galigeo Manager tab, and go back to our map.
Let’s go back to our datasource configuration (click on the Data tab from the left menu).
Click again on the pen icon next to the datasource title, and switch to the Mapping tab.
We are going to create another mapper, to be able to display our KPI at district level.
Click on the + tab on the bottom to create a new mapper.
Select « Ward Code » from the first input list.
Then click on the « Automapping » button, and Galigeo will find automatically to which geodata bind the Ward Code dimension.
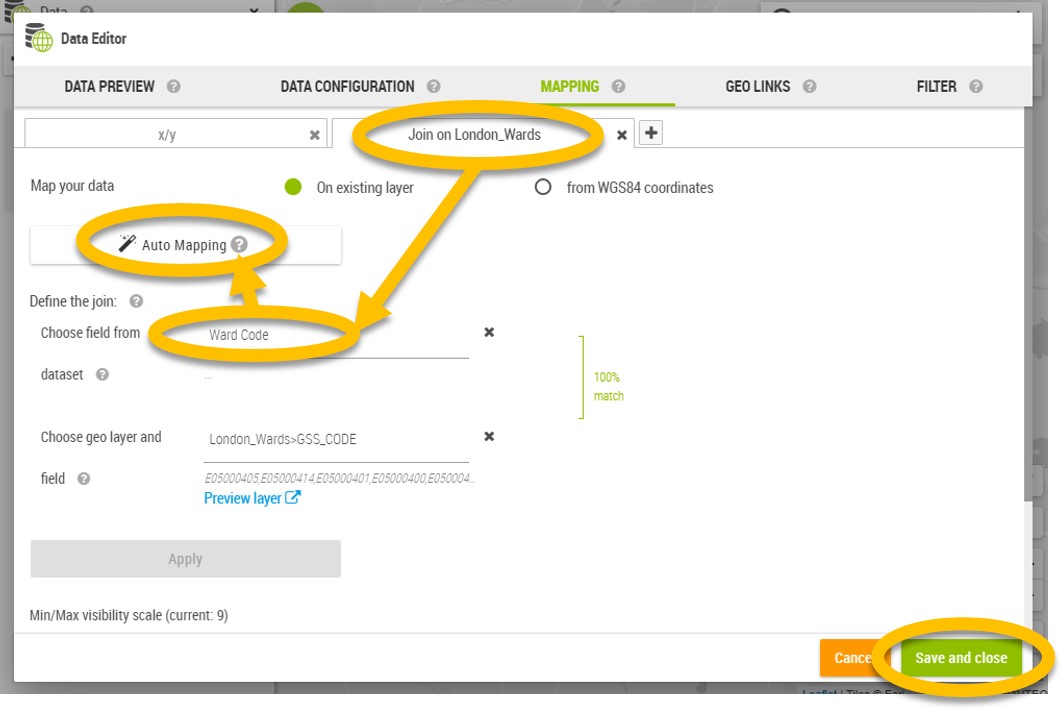
Once done, click on Apply to see the match % between the Ward Code values and the ones from the geodata selected.
Then hit the Save and close button.
Alright.
We are now going to create our new layer of information based on these Ward Code.
Let’s see another way of creating such layer.
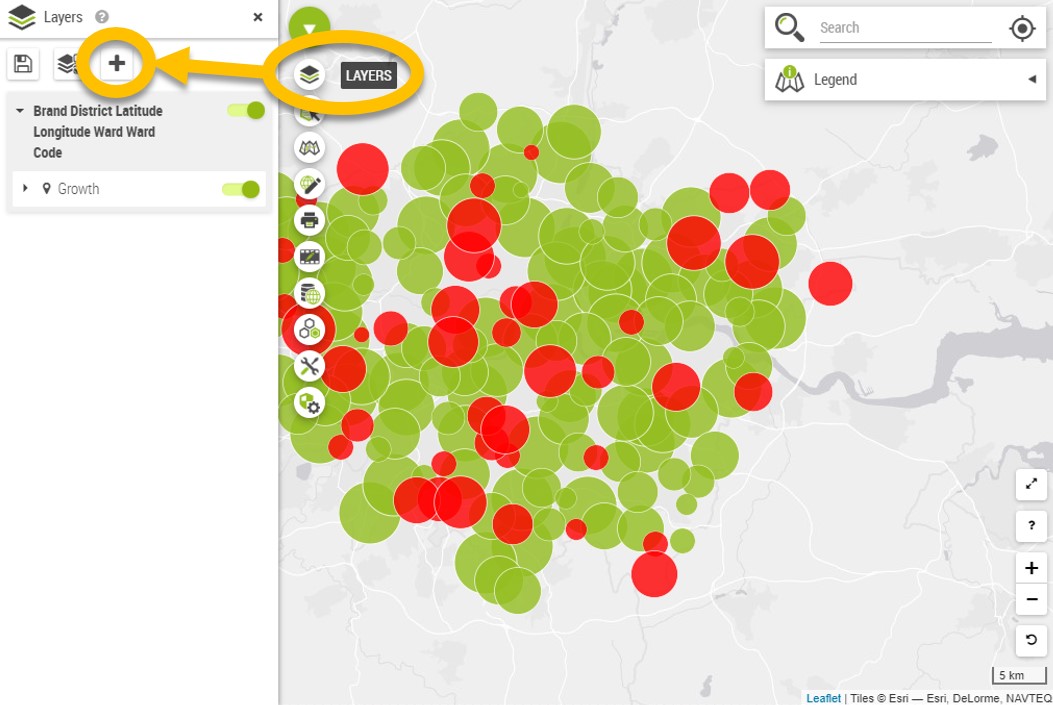
Go to the Layers tab, and click on the + icon on the top.
It will open in a new window the Thematic Assistant.
Let’s go to a new step and understand how the Thematic Assistant works.
4. Creating Layer of Information with the Thematic Assistant
It gives a lot of options to configure different Thematics, also called Layer of Information, that will represent your KPI at different levels on the map.For this demonstration, we will stick with the core configuration needed.
Choose the Range of Colors type of representation.
A new configuration list appears.What we will define here are:
- The name of this new Layer of Information, for example Revenue by Ward
- The mapper defined in the #previous step to be used, from the Select geographic level drop-down list
- The KPI used to create the layer, in our case the Revenue.
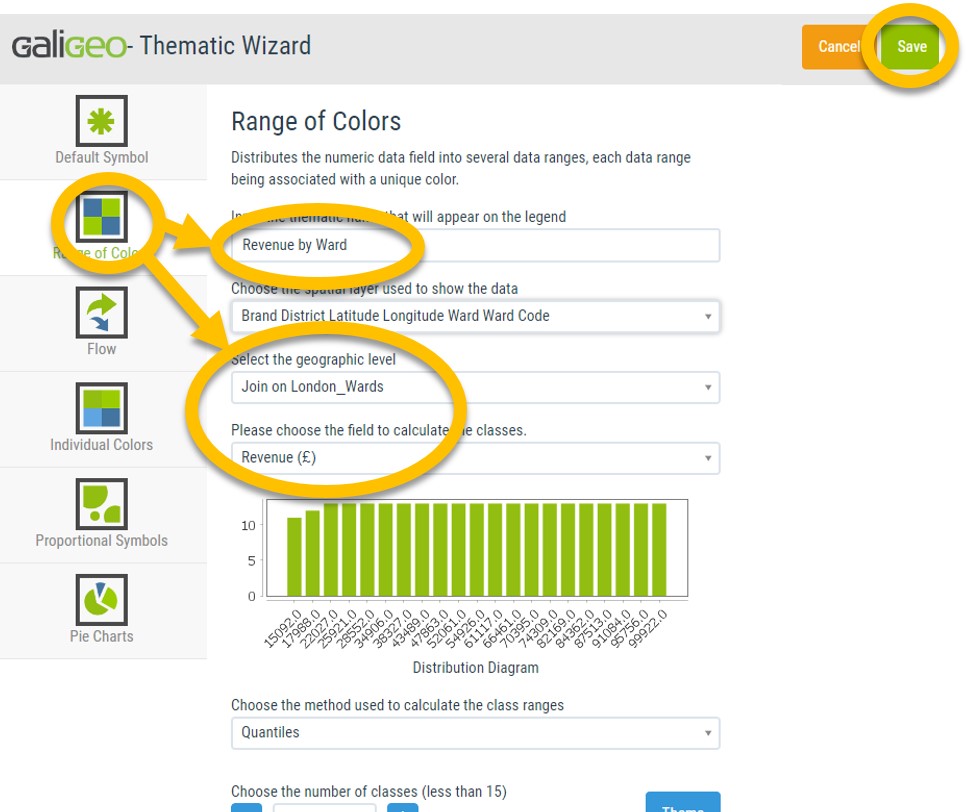
Of course, we could go further into the configuration, for example choose the method used to calculate the class ranges, define conditional formatting, configure labels, …
But for the time being, let’s hit the Save button on the top-right.
When prompted to close the window, do it, and go back to your Webi report.
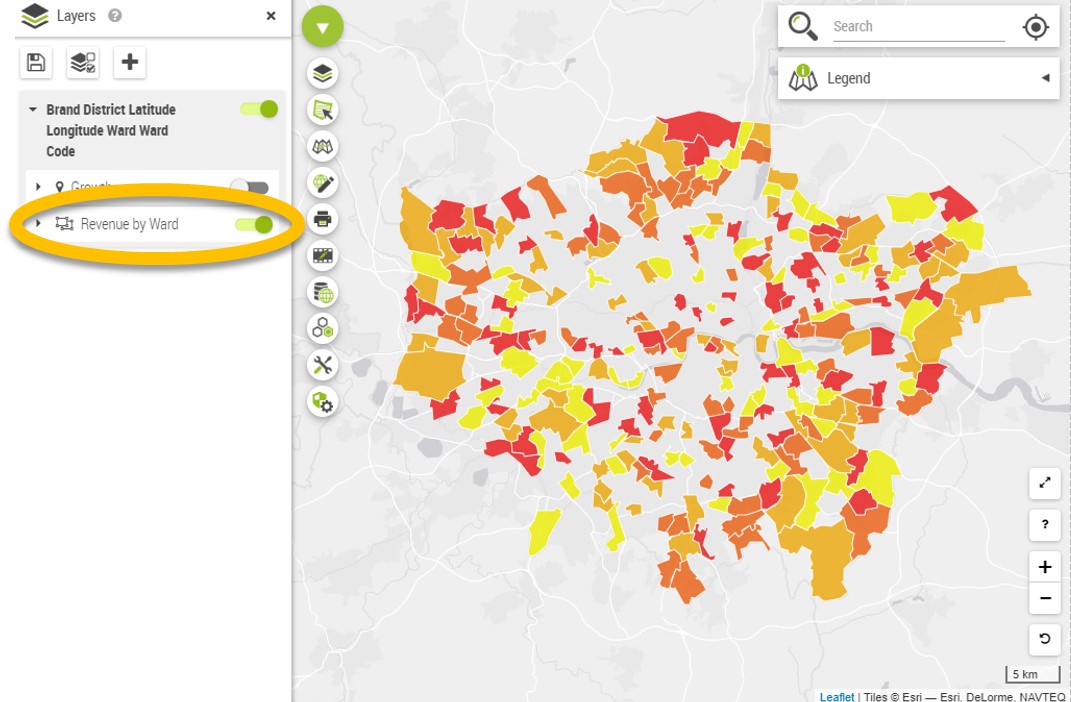
You will now see a new layer appearing on the map, displaying the Revenue aggregated by Wards.
From the Layer menu, you can toggle on and off the visibility of the different layers of information you created.
You can now go switch back to Read mode for your Webi report, and start exploring the map you just created.
Congratulations ✌!
5 Going Further
How much did it take to create your first map? 5 minutes max I’m guessing ?.
This tutorial gave you a sneak peek of how you can plot your data on the map with Galigeo For IBM Cognos Analytics, but of course there are still many other ways to be explored.
We now encourage you to play a bit with the map you just created to familiarize more with the product, and explore the different functionalities.
For instance, you now could try to:
- Choose another basemap
- Use a selection tool to extract data from the map
- Display the Revenue by Stores as a Heatmap
In the next guides, you will be able to go further and create richer maps by leveraging the wide set of functionalities proposed by Galigeo like:
- Personalize the way your layers of information look like
- Animate your data with the buit-in Time Series module
- Create advanced geovisualizations, like Flows
- Personalize the data infowindow to improve User Experience
- …
Subscribe to our newsletter and stay tuned about Galigeo products and Location Intelligence